CivicScience engages directly with consumers, collecting over one million survey responses daily, to turn real-time insights into high-performing advertising campaigns. See how leading brands use CivicScience to drive campaign performance here.
Streaming and other distribution channels have reshaped how Americans watch — and what they even define as “watching TV”. The audience content creators thought they understood has reoriented itself. CivicScience data, drawn from real-time consumer responses, reveals an audience identifying itself along clear lines of behavior, platform, and generation. Media companies should treat that segmentation not as a problem but rather as a map.
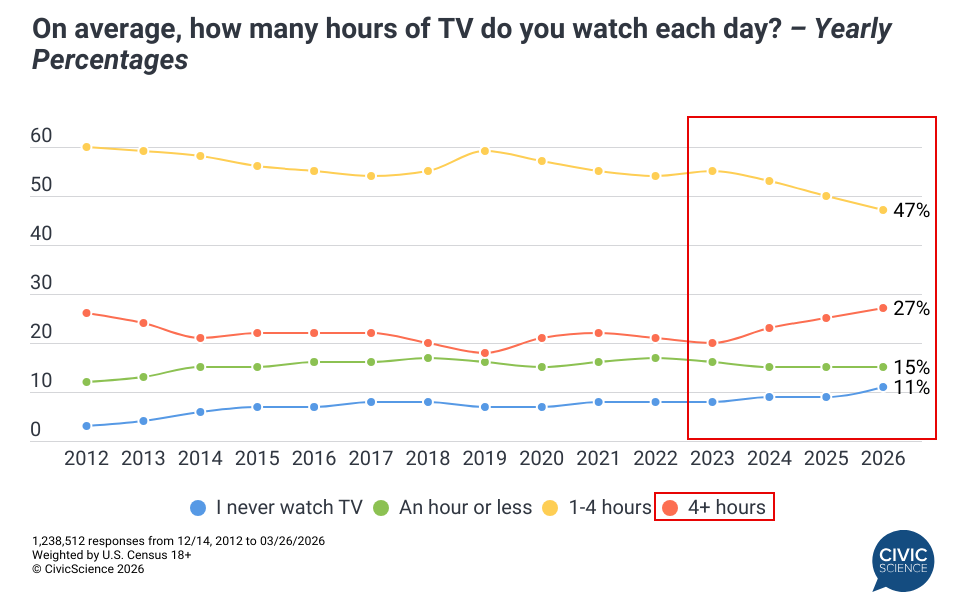
America’s TV Habits Are Pulling to the Extremes
CivicScience has tracked daily TV viewing habits since 2012. After years of relative stability, the share of Americans watching 1-4 hours a day has started to decline, but the audience hasn’t completely tuned out. It has split. Power viewers (those watching more than 4 hours per day) have grown by 35% since 2023 and now make up more than one-quarter of the U.S. adult population. At the same time, the percentage of Americans who say they “never” watch TV has grown from 3% in 2012 to 11% today. The middle is thinning from both ends, with power viewers watching more and a growing minority consuming content in other formats and/or through other distribution channels, which, notably, they don’t define as TV.
The Strategic Takeaway: Content creators should resist treating the TV audience as monolithic. The most frequent viewers and the non-viewers represent different content relationships, and the moderate middle that once defined the mass audience is shrinking.
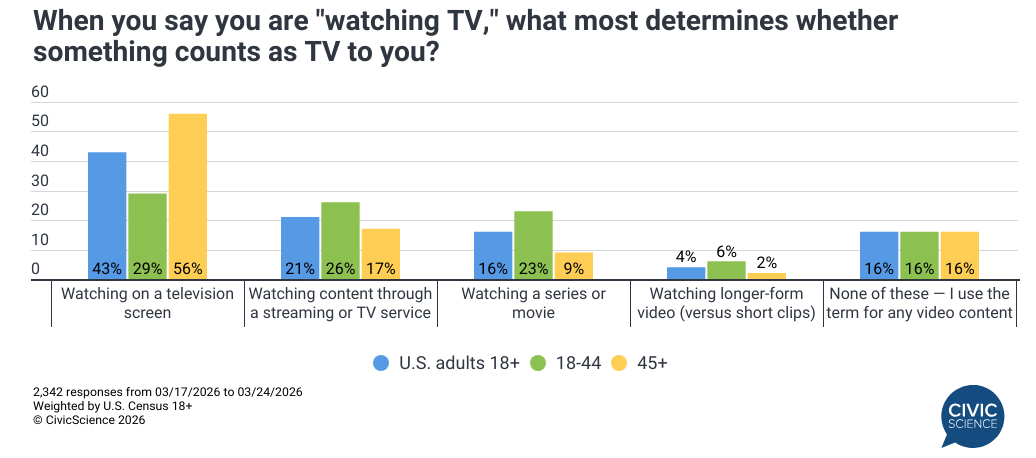
“TV” Means Different Things to Different Generations
That split doesn’t just show up in how much Americans watch; it’s also visible in what they define as watching. Among the general population, the physical television screen is the most common anchor for what counts as “watching TV,” but that definition is far from universal. Fewer than half of U.S. adults cite the television screen as the primary determinant. Another 21% define it by the streaming or TV service, 20% by the content type (e.g., series, movie, or longer-form video), and another 16% apply the term to any video content regardless of platform or format.
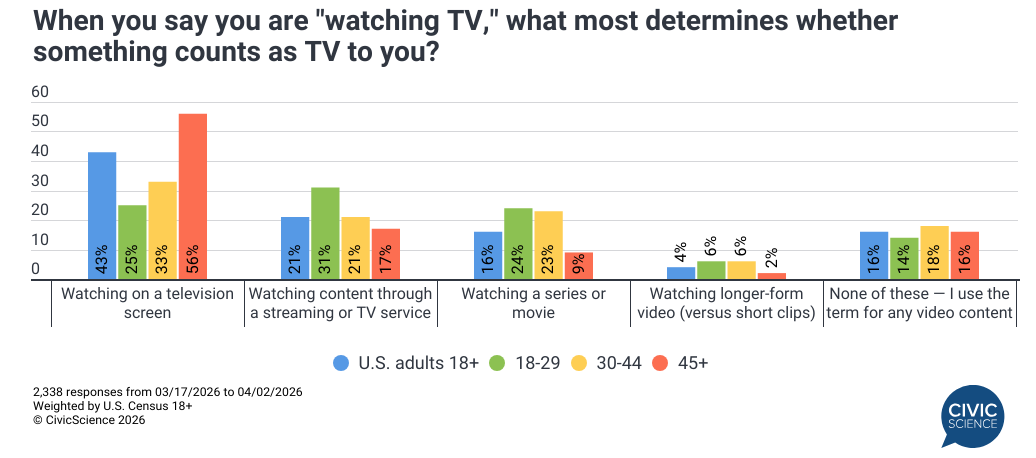
The generational breakdown reveals more nuance than a simple young/old divide. Gen Z, aged 18-29, is almost evenly split between TV screen, series or movies, and streaming content, but their most popular choice for defining TV is ‘watching content through a streaming or TV service.’ Millennials (30-44) are also almost balanced, but in the opposite direction. It’s also notable that 17% of 45+ choose streaming. Perhaps most surprising: roughly 16% of adults across all age groups use the term for any video content at all — and that figure is remarkably consistent across generations.
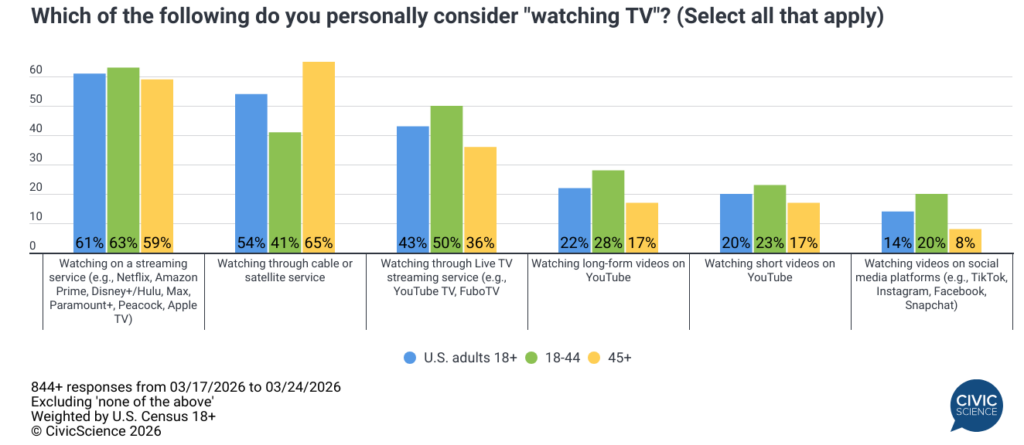
A more granular look at which specific platforms people include under the “TV” umbrella further illustrates the divide.
Just over 6 in 10 U.S. adults now consider video-on-demand streaming services “TV,” outpacing traditional cable or satellite at 54%. But that overall figure masks a meaningful age split: among 18- to 44-year-olds, on-demand streaming leads cable 63% to 41%. Among adults 45+, the order flips — 65% consider cable as TV, while 59% say on-demand streaming is TV. vMVPDs (Live TV streaming services, e.g., YouTube TV or FuboTV) register 43% overall, rising to 50% among younger viewers. Social media is where the generational gap is sharpest: 20% of 18- to 44-year-olds consider watching social video (e.g., TikTok, Instagram, Facebook, or Snapchat) “watching TV,” more than doubling the 8% among adults 45+ (excluding ‘none of the above’).
The Strategic Takeaway: There is no longer a singular definition of television as the vacuum tube box in the living room with (maybe) 4 stations. While some older viewers have a definition not dissimilar to that, most people have much broader criteria. For younger viewers, the definition of TV is closer to a generic term, referring to much, if not all, of their long-form video consumption.
Meeting Viewers Where They Are
Viewership habits and shifting definitions matter most when they point to something actionable. On-demand streaming leads among the general population and dominates across every age group under 55. Notably, its strongest showing isn’t among the youngest viewers — it’s among 35- to 54-year-olds, at 45%. The outlier, meanwhile, is 55+, where traditional media commands 41%, and streaming falls to 28%. Among viewers under 35, live TV streaming and YouTube both have meaningful shares, underscoring that the non-cable/broadcast audience isn’t monolithic.
The Strategic Takeaway: Platform reach is age-dependent in ways that resist easy generalization. Content creators optimizing for a single platform, even streaming, are likely missing significant viewer segments at both ends of the age spectrum. The most durable audience strategies account for platform distribution across generations, not just the one that indexes highest overall.
The Bottom Line
Overall, this data paints a consistent picture: audiences are more segmented than ever, but that segmentation is a feature, not a problem. Content creators who understand which platforms command their target audience’s attention are the ones best positioned to turn fragmented viewing habits into lasting revenue.
The publishers winning today are the ones adapting to the latest consumer attitudes.
CivicScience gives our media and publisher partners the real-time consumer intelligence to do exactly that.