This is just a preview of the insights available from CivicScience. Want to see how your brand stacks up against the competition? Get started.
With peak travel season here, Americans are hitting the roads or taking to the skies. But with spending top of mind for many consumers, the post-pandemic vacation travel boom may be coming down from its high.
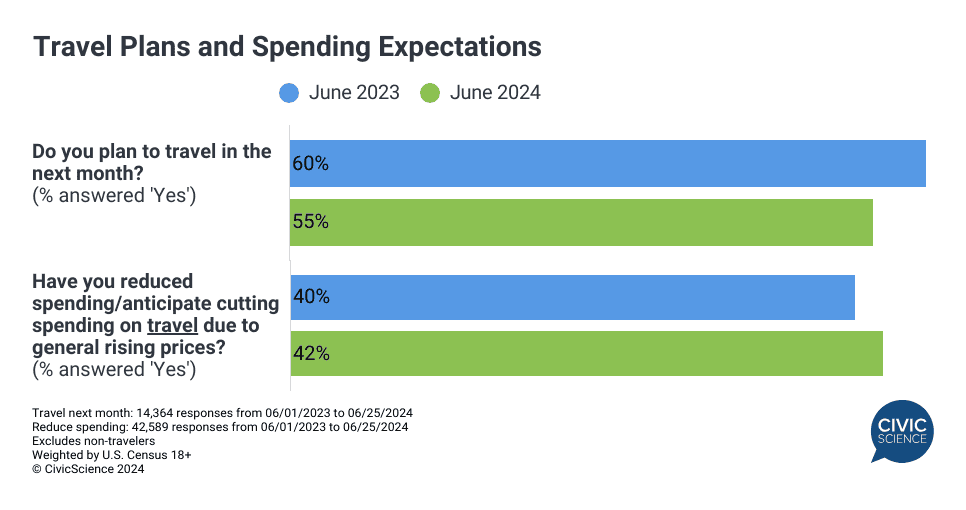
June data tracking from CivicScience show that 55% of U.S. adults say they plan to travel in the next month, down from 60% last June. At the same time, 42% of consumers say they plan to cut back on travel out of concern for the general high cost of living, compared to 40% this time last year.
Of course, not at all travel is vacation travel. In the next three months, 43% of U.S. adults say they will be taking a vacation.1 Where will they be staying and how much do they plan to spend? CivicScience ‘always-on’ consumer data reveal key insights into how Americans are vacationing this year:
More Vacationers Heading to Airbnb’s and Rentals
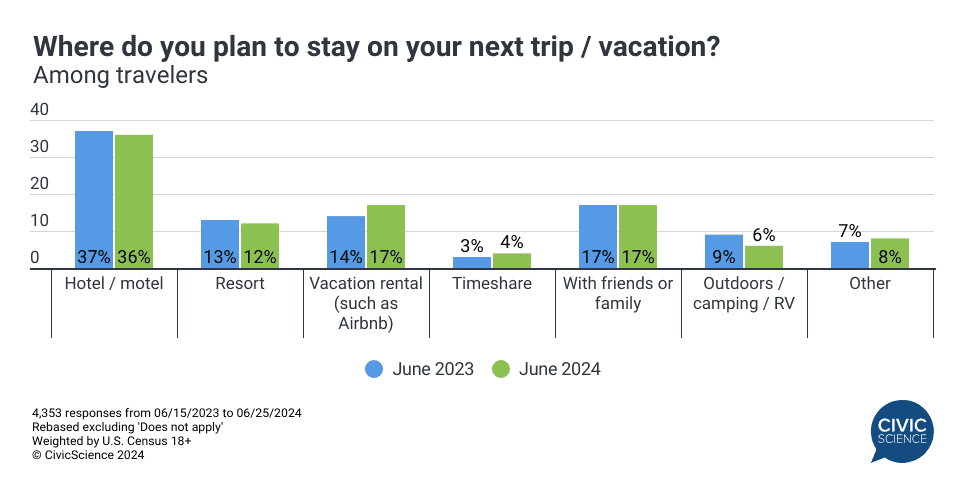
Among those who will be vacationing this summer, 17% say they plan to stay at an Airbnb, Vrbo, or vacation rental on their next trip, up from 14% last June. While the percentage of vacationers planning to stay in hotels has fallen slightly, hotels are still the most preferred accommodation. Notably, far fewer Americans plan to go camping this season, trading the great outdoors for the comforts of an Airbnb or a timeshare. In addition, slightly fewer people plan to stay at resorts.
One factor with the potential to disrupt hotel and Airbnb reservations? Bad weather, especially hurricane season for those heading to beaches in the U.S. South. Americans who live in the Northeast or Midwest regions are the most likely to have had to postpone or cancel travel plans in the past year due to weather-related issues.2 Severe weather events have impacted more than half of Americans.
Join the Conversation: When you travel, what type of accommodations do you prefer?
How This Year’s Vacationers Are Spending
As previously mentioned, expectations for July travel (typically the busiest summer month) are down this year as more Americans plan to cut back on summer travel. However, vacationers are likely to spend more on their summer trip(s) this year – 32% say they’ll spend more than last year, while 22% will spend less (and 46% will spend the same).3
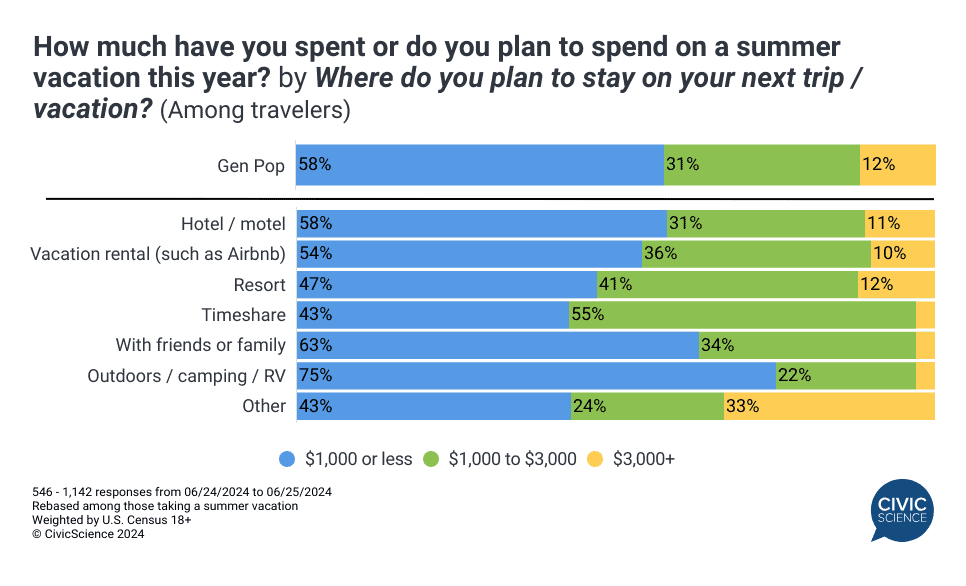
In terms of actual dollar amount, a majority (58%) plan to keep travel expenses to $1,000 or less, which is no easy feat considering the average cost of a one-person vacation for one week in the U.S. is estimated to be around $2K. For families, budget constraints are likely contributing to the added stress of travel planning.
In a look at rentals versus hotels, hotel users are more likely to be budget-conscious and spend less than $1K. Just over 1-in-2 vacation rental users are also unlikely to spend more than $1K.
Take Our Poll: Do you typically splurge on a luxury hotel when you go on vacation?
Despite an overall noted decrease in travel and travel spending, vacationers are still flocking to hotels and even more so to vacation rentals, with many anticipating spending more than last year. How they’ll spend is another question, considering the growing trend of alcohol-free vacations among young adults.
What motivates consumers to take vacations in the first place? ‘Fun and adventure’ tops the list among this year’s travelers, followed by ‘rest and relaxation’ and ‘visiting family and friends.’4 Consumers taking a summer vacation are more than twice as likely as those not taking one to say that traveling for pleasure is important to them.5 However, the wealthier someone is (in terms of annual household income), the more likely they are to value travel. Money may not buy happiness, as the adage goes, but data suggest it can buy a great vacation.
Check out even more consumer insights about the difference between Airbnb and hotel users here.


