CivicScience has the world’s largest proprietary database of real-time declared intent, allowing brands to activate high-performing advertising that drives up to 80% better performance. See how CivicScience partners achieve superior marketing outcomes here.
1. Younger Americans are more likely to visit urgent care centers, and hospital-affiliated centers are most popular.
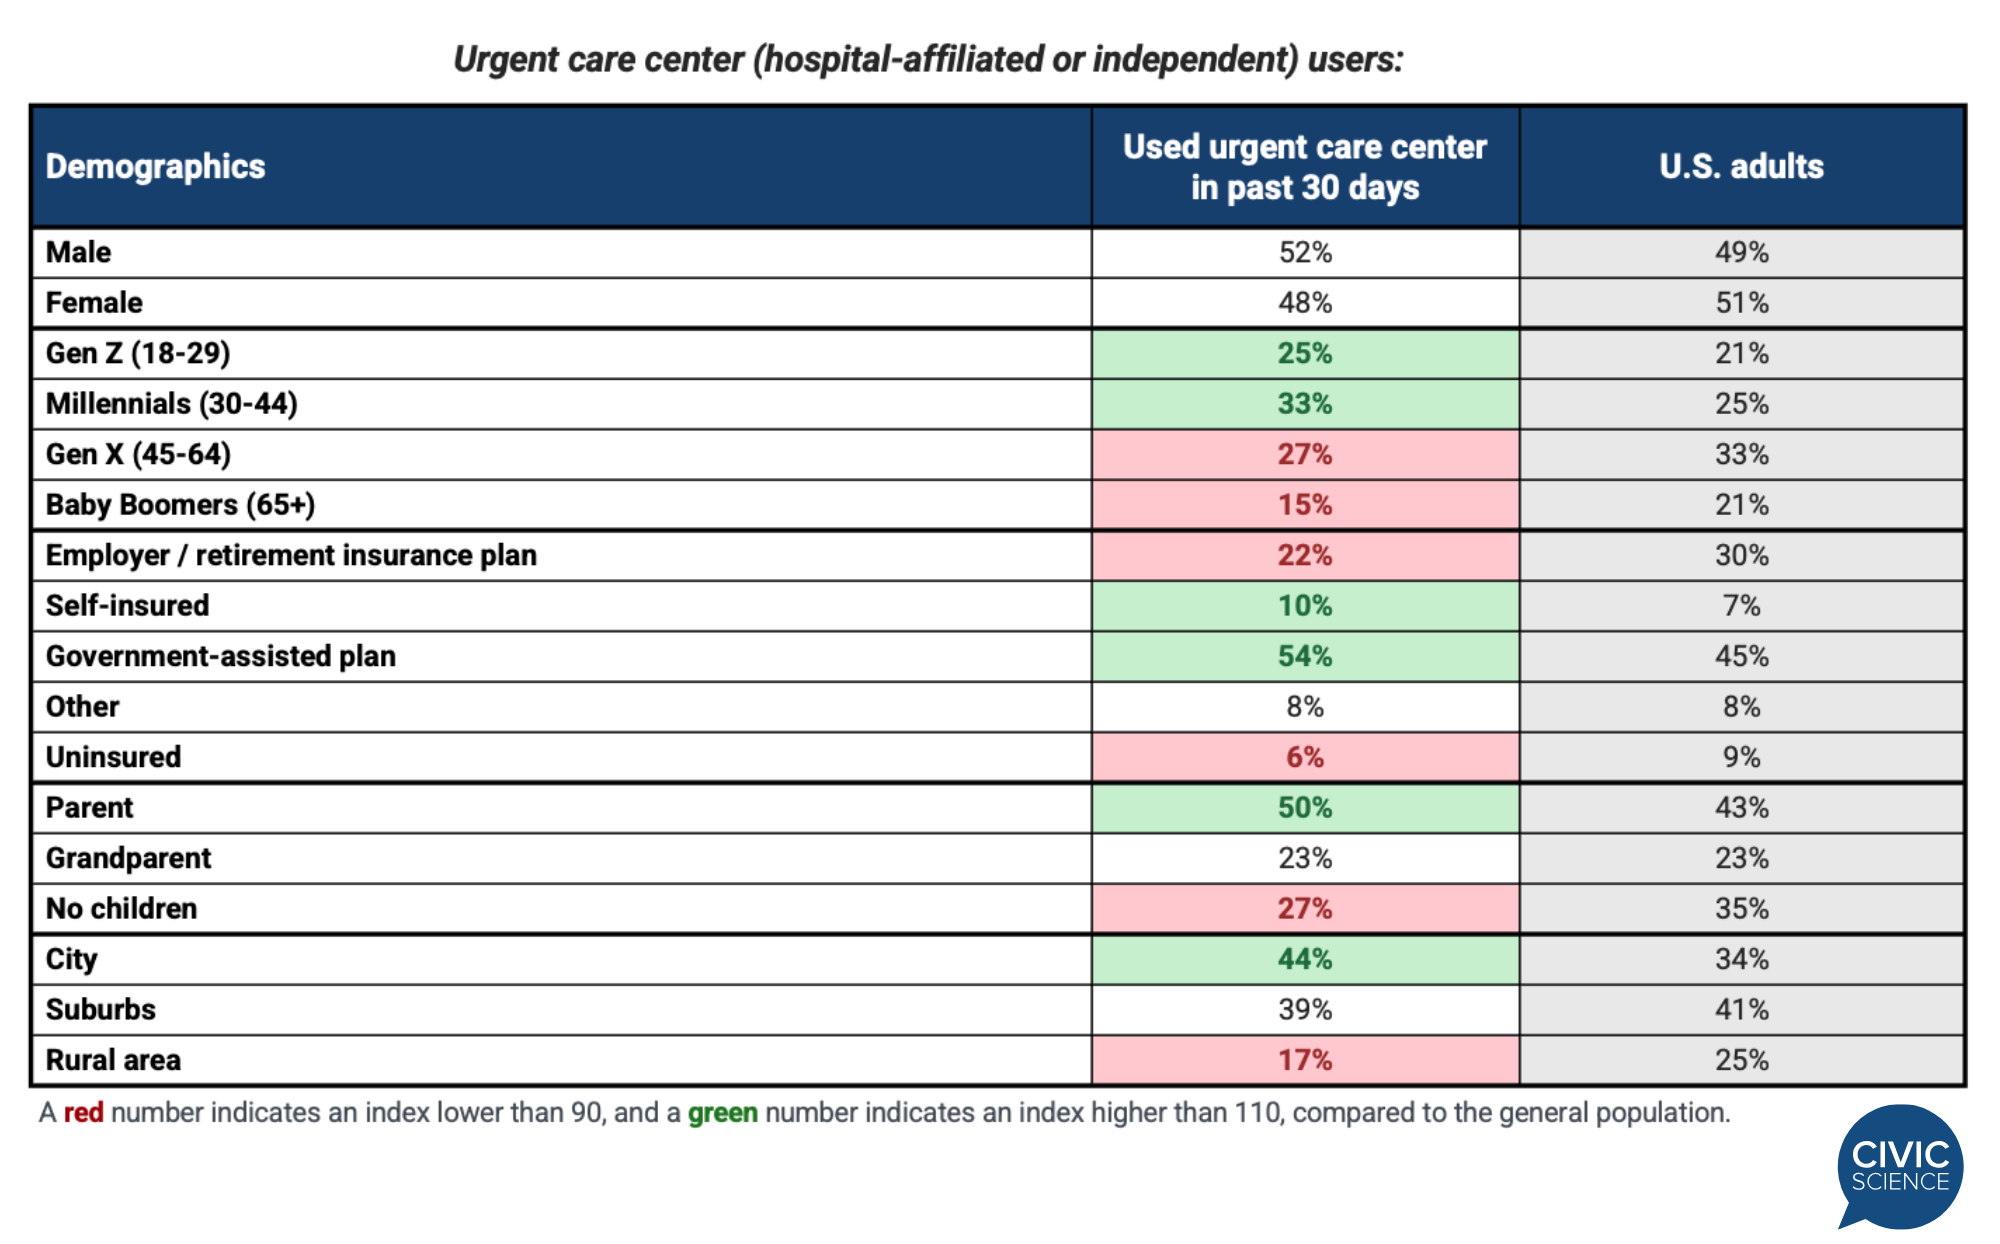
Amid rising healthcare costs and 42% of U.S. adults at least ‘somewhat’ likely to switch health insurance, urgent care centers have become a staple for many Americans. New data from CivicScience show that since November 2025, between 17% and 22% of adults say they used a hospital-affiliated urgent care center. May and June were the most popular times, peaking at 22%, with 18% using one in October 2026. Independent urgent care centers followed a similar trend, with 15%-19% visiting, peaking in September.
The convenience and cost of urgent care centers appear to fill an important gap for many Americans. Younger generations make up an outsized share of urgent care users overall. Millennials account for 33% of users (vs. 25% of Gen Pop) and Gen Z for 25% (vs. 21%). Parents (50% vs. 43%) and city dwellers (44% vs. 34%) are also overrepresented. Americans with employer-sponsored or retiree insurance plans are underrepresented, making up 22% of users compared with 30% of U.S. adults.
Take Our Poll: Do you personally rely on urgent care facilities for non-emergency medical needs?
2. Holiday gift card buying intent is up for 2026, with restaurants winning the largest share.
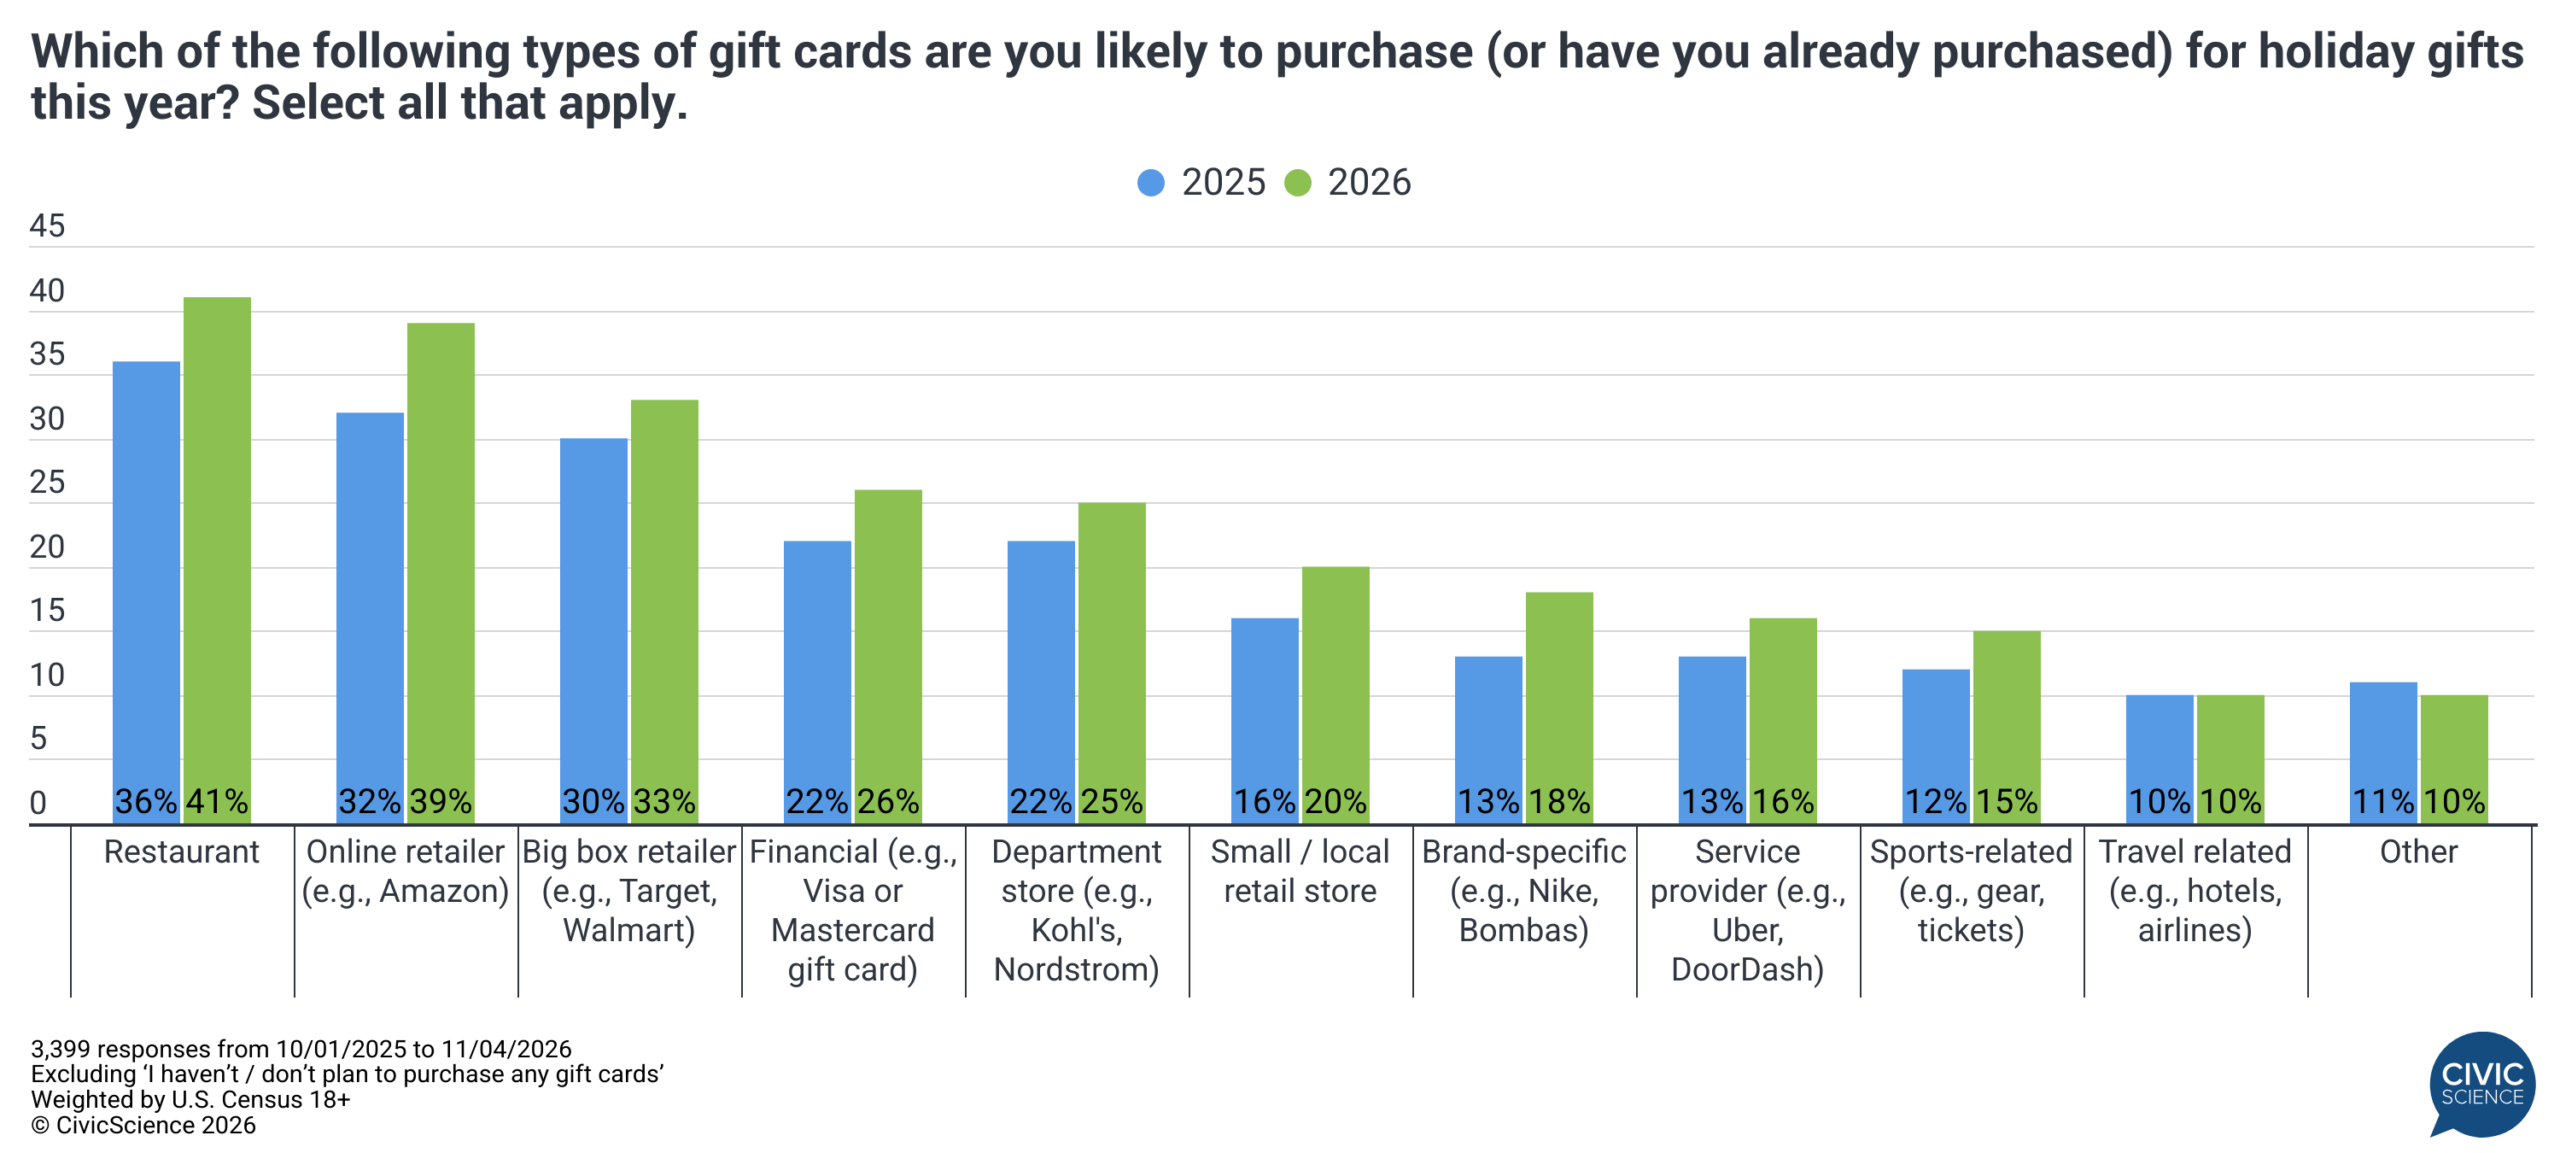
As the season of struggling to figure out what to get everyone in your life as a gift dawns, more Americans plan to give a gift card this year. The share of Americans ‘very’ likely to purchase gift cards has risen six percentage points since 2022 to 32% in 2026, matching the share who are ‘not at all’ likely (excluding those unsure). Stress seems to play at least some role in who buys gift cards. Thirty-five percent of those expecting ‘more’ holiday stress this year plan to purchase them, compared with 27% of those expecting ‘less.’
Among gift card buyers, intent rose in every category except ‘travel’ and ‘other.’ Restaurant gift cards lead the bunch at 41%, up from 36% in 2025. Online retailers, such as Amazon, follow at 39%, along with big box stores (33%). Divides appear when examining the data by age. Baby Boomers (65+) and Gen X (45-64) are more likely to purchase restaurant gift cards, at 49% and 46%, respectively. Gen Z and Millennials are far more likely to give service provider cards like Uber or DoorDash (24% and 22%, vs. 5% of Boomers) and brand-specific cards (24% and 23%, vs. 8%).
3. 42% of respondents are cashing in on post-Halloween candy sales, and half are keeping their costumes.
With trick-or-treating and a full weekend of festivities over, one question remains: What happens to the leftover candy and costumes? Overall, 17% of Americans say they’ve already bought discounted candy since the holiday, and another 25% plan to do so (excluding those unsure). Unsurprisingly, bargain candy is most popular in lower-income households, where 19% of those earning under $50K have already bought some and 31% plan to. Among those earning $150K+, just 8% already have, and 15% intend to.
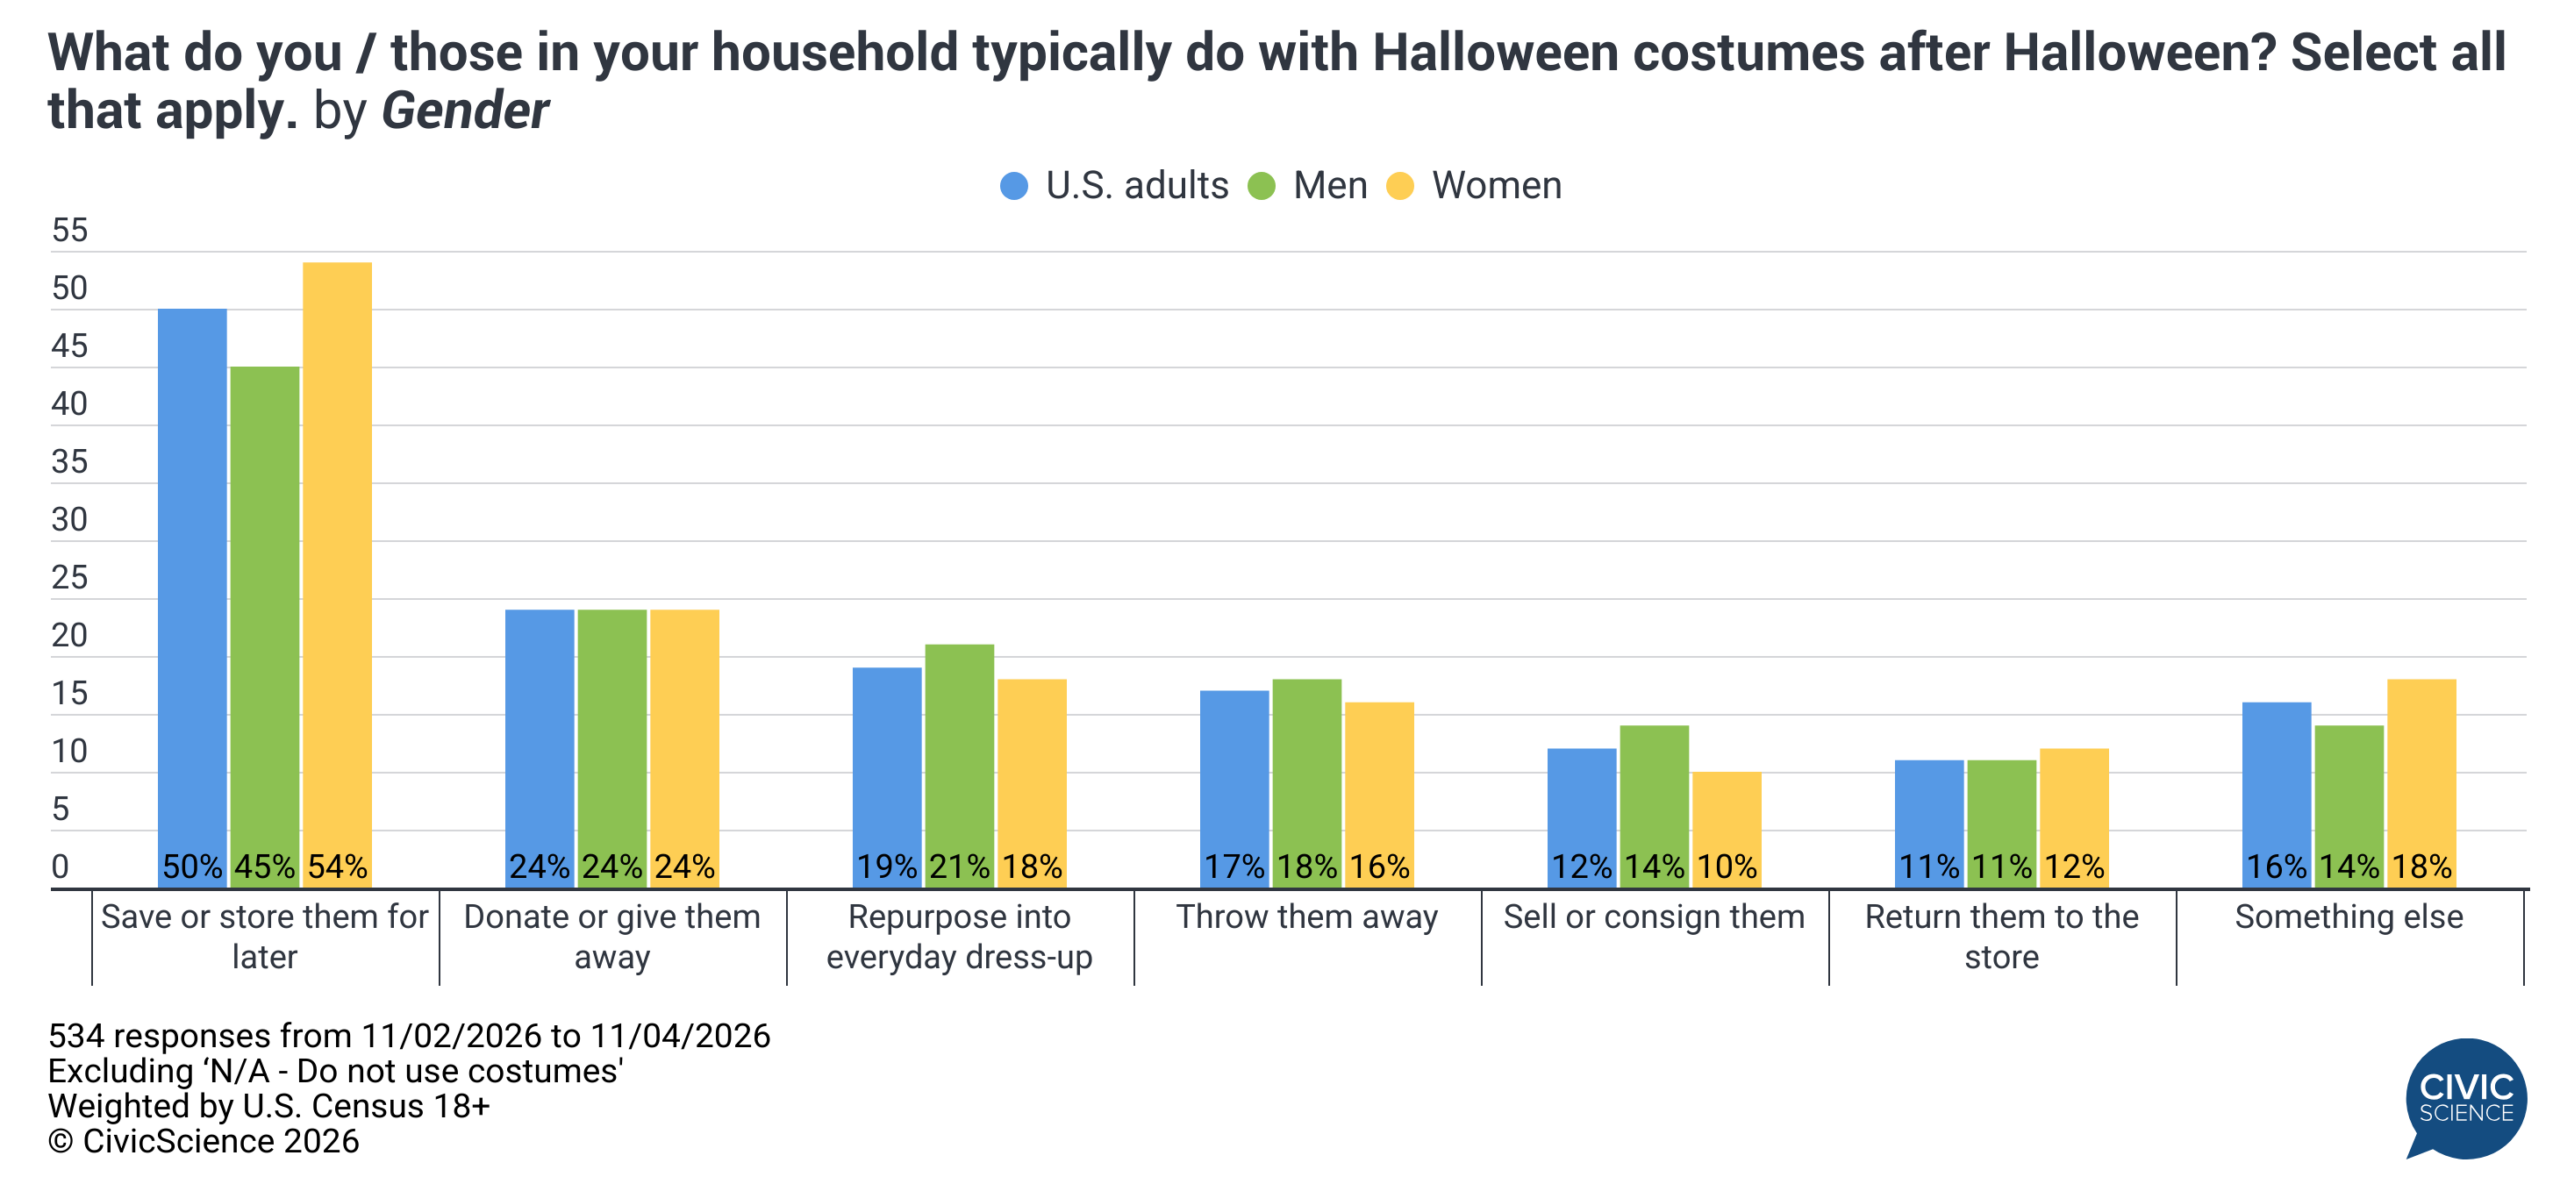
As for costumes, half of costume users (50%) save or store them for later, compared with just 17% who throw them away outright. Women are more likely than men to hold on to them for later (54% vs. 45%), while men are more likely to sell old costumes (14% vs. 10% of women). About a quarter (24%) donate or give costumes away, and 19% repurpose them for everyday dress-up.
Let Us Know: Are you a fan of DIY costumes?