CivicScience has the world’s largest proprietary database of real-time declared intent, allowing brands to activate high-performing advertising that drives up to 80% better performance. See how our partners achieve superior marketing outcomes here.
1. About a quarter of U.S. adults report recent or potential friction with their political party alignment, rising to 48% among Gen Z adults and 31% among self-identified Republicans.
While many Americans remain firmly locked into their political identities, a notable undercurrent of political realignment is emerging across the population, especially younger consumers. The latest CivicScience data show 49% of U.S. adults have maintained their party affiliation with no plans to change, while 26% identify as lifelong independents. However, about one-quarter (26%) of respondents report recent or potential movement — 10% say they have recently changed their party affiliation, and an additional 16% have actively considered it.
This political restlessness is heavily concentrated among Gen Z, where nearly half of the demographic (48%) have either changed or considered changing their party affiliation. By comparison, self-identified Republicans report slightly higher rates of recent party switching or consideration (31%) than Democrats (28%).
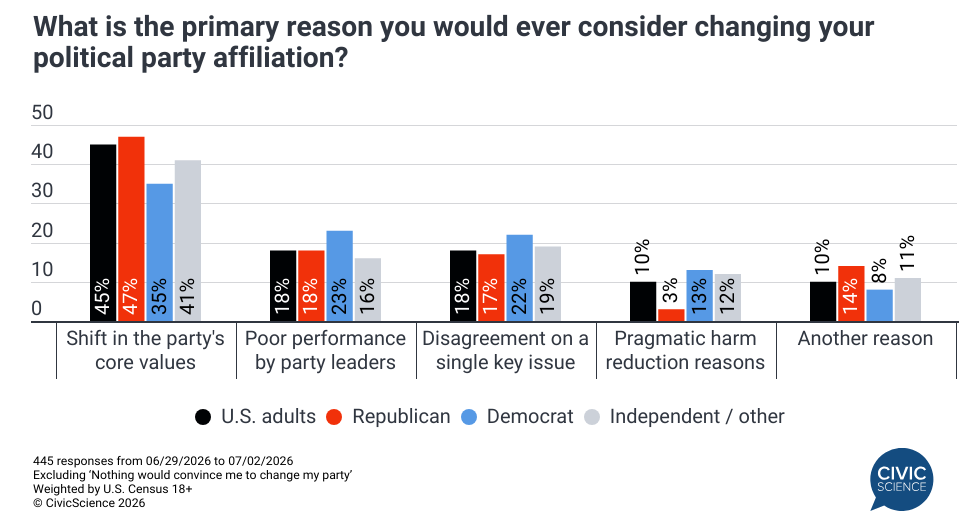
Among the Americans who would consider breaking ties with their current political affiliation, ideological misalignment is the primary driver. A shift in a party’s core values stands out as the single most powerful catalyst, cited by 45% of U.S. adults overall, with Republicans most likely to cite this reason. Beyond party values, registered Democrats are uniquely sensitive to execution and leadership – 23% of Democrats cite the poor performance of party leaders as their primary reason for a potential switch. Democrats are also notably more likely than Republicans (13% vs. 3%) to say they would switch affiliations for pragmatic harm-reduction reasons.
2. Americans are becoming increasingly dissatisfied with their credit scores.
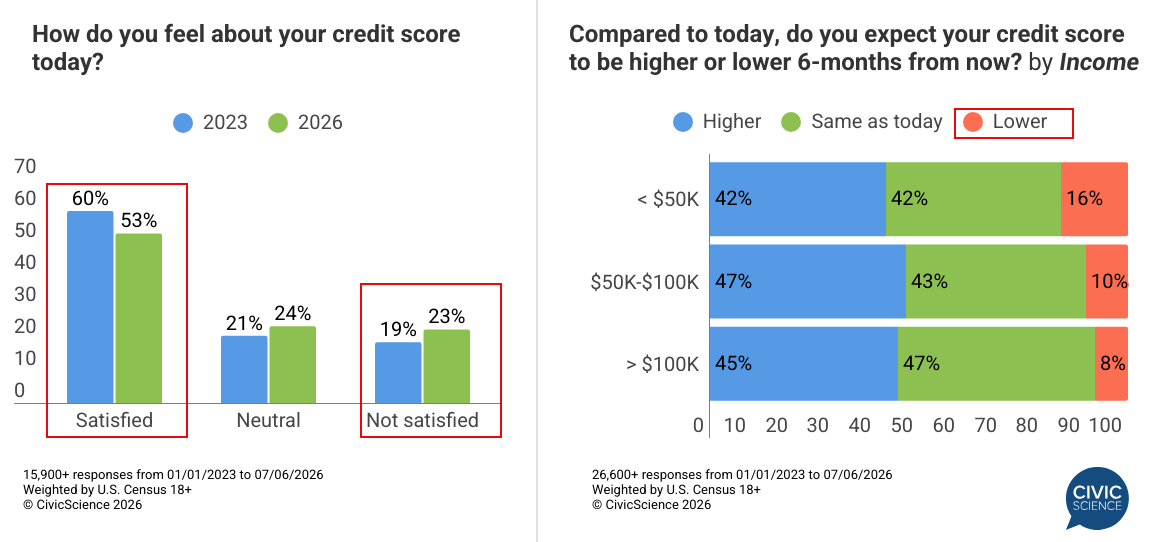
A growing share of Americans is falling behind on their credit card bills. While this has several residual impacts, the effect on their credit scores is noteworthy. The latest consumer-reported tracking data from CivicScience shows the percentage of consumers who are ‘satisfied’ with their credit score today has fallen from 60% in 2023 to 53% so far in 2026. At the same time, nearly one-quarter tell CivicScience they are dissatisfied with their credit score, a four-point increase since 2023. Unsurprisingly, those unsatisfied are nearly 70% more likely than those satisfied to say that they’re spending over the past seven days is less than usual for this time of year.
A look at consumer credit score outlook reveals much less of a swing overall, with those expecting their score to increase falling by just two points YoY (47% in 2023 to 45% so far in 2026). That said, those with the least financial breathing room – those making under $50K per year – unsurprisingly are more than twice as likely as high-income earners ($100K+) to believe their credit score will decline.
While the majority remain satisfied with their score, additional data show they’re not getting complacent. In fact, a slim majority (52%) of U.S. adults have recently taken some form of action to manage their credit score. The most common strategies involve checking credit reports for errors (19%), keeping credit usage below the recommended 30% threshold (18%), or opening a new secured credit card account to help build up their score (14%). Requesting a credit limit increase (10%), becoming an authorized user on someone else’s card, aka “credit piggybacking” (10%), or using a credit boosting app (9%) are more niche actions.
Let Us Know: How many credit cards do you currently have?
3. Seven in ten Americans maintain a financial budget, but tracking cycles vary widely between Gen Z and older generations.
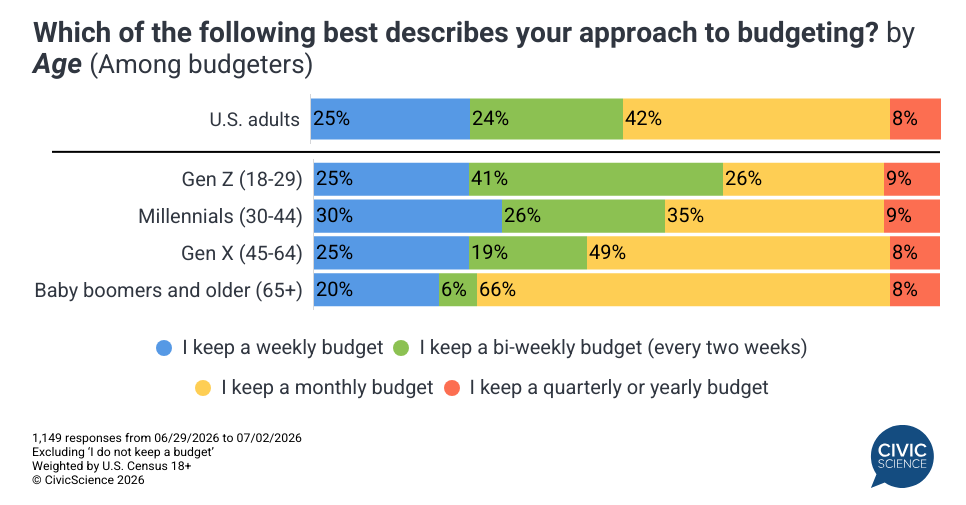
Speaking of the financial sector, CivicScience also examined how Americans approach budgeting. New data suggest that budgeting is a staple of personal finance for most Americans, with 71% of U.S. adults reporting they maintain a financial budget. Among them, monthly budget tracking is the most common cadence at 42%, followed by weekly (25%) and bi-weekly (24%). However, budgeting habits shift dramatically by generation; younger consumers favor shorter, income-aligned intervals, with 41% of Gen Z budgeters tracking expenses on a bi-weekly basis. In stark contrast, older demographics prefer macro-level tracking, as 66% of budgeters aged 65+ opt for a monthly schedule.
Naturally, this focus on financial planning also impacts financial product research. When seeking information on financial products, consumers in general and those who say they budget rank search engines and banks/financial institutions as the leading sources for product research. Notably, however, those who budget are 54% more likely than the average consumer to say they research financial products on aggregator sites, such as NerdWallet or Bankrate.
Weigh In: How much of your personal budget is dedicated to entertainment and experiences?