From the second we start getting letter grades in school, we’re pushed to reach for the top. Straight A’s, 4.0s, awards – everything. In college, that pressure to maintain a high GPA can cause insane amounts of stress. The logic goes something like: Good GPA → Good Job → Good Income → Happy → Healthy → etc…
But is this true? Are some students breaking their backs to achieve a simple numerical value that does not have as much weight as they think once they leave campus?
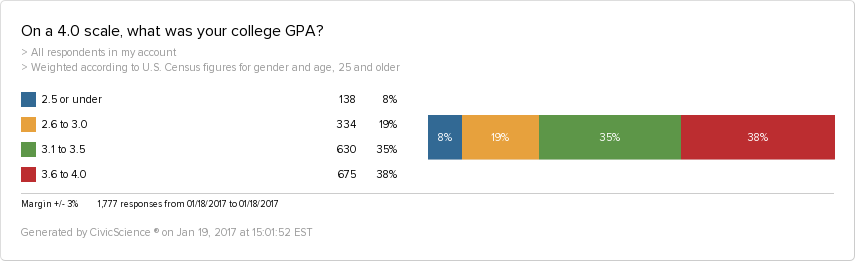
To find out, let’s follow the constructed logic that I’ve mentioned above, and see what we can learn from real-life data. Take a look at these topline numbers among U.S. Adults 25+ (excluding those who answered “Does not apply” and the 8% who answered “I don’t remember”):
Job Satisfaction
Though it’s almost impossible to tell a “good” job from a “bad” job, we are able to measure people’s happiness at their jobs. Take a look:
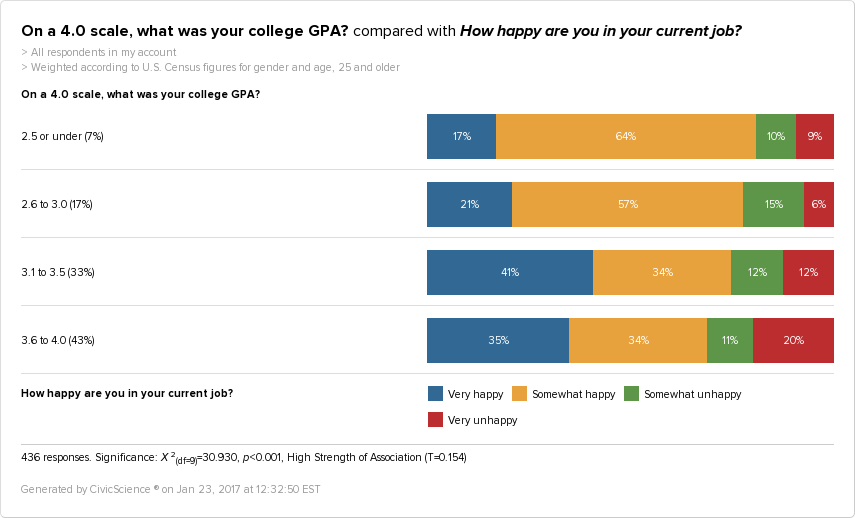
As you can see, there does seem to be a correlation between GPA and happiness at work. Only 17% of folks with a 2.5 or under say they are “Very happy” at work, while that number rests between 35% and 41% among those with a 3.1 or higher.
However, those who had a GPA between 3.6 and 4.0 are more likely to say they are “Very unhappy” in their current job than other alumni. There are only 19% of folks with a 2.5 or under who say they are unhappy (either somewhat or very) in their current job, compared to 31% among the highest GPA tier. In addition, those with a 2.5 or under are most likely to say they are “Somewhat happy” in their current job.
But Wait – I Can’t Get a Lucrative Job with a Low GPA! Can I?
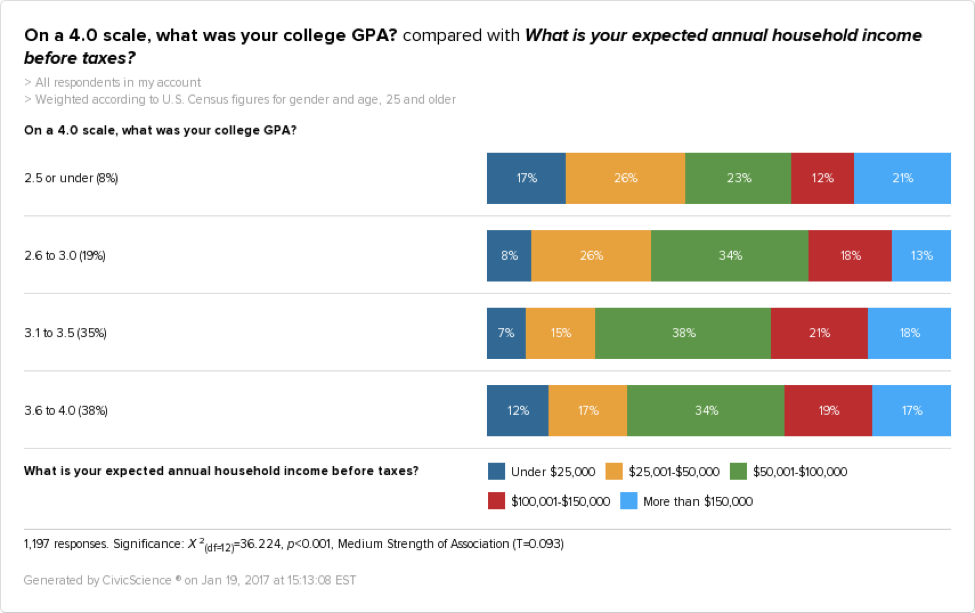
So it’s true – those who had a 2.5 or lower in college are the most likely to make under $25k, and more generally, under $50k. That said, 21% of that group makes more than $150k each year, which is higher than any other group. As a trend, however, it is evident that as GPA increases, income tends to increase as well – with a few exceptions of course.
But following the next train of thought – what about happiness in general?
Don’t Worry. Be Happy
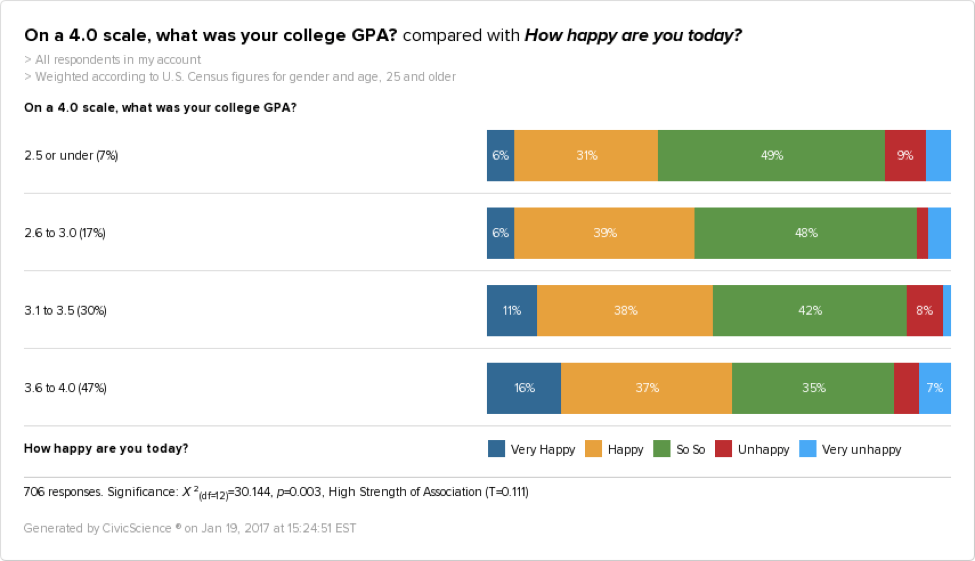
So here we do see a more clear correlation. 16% of those with a College GPA of 3.6 to 4.0 say they are “Very happy”, while only 6% answer the same among those with a college GPA of 2.5 or lower. In addition, those who had a GPA of 3.1 to 3.5 are least likely to say they are “Very unhappy.”
On the flip side, those with a GPA of 3.6 to 4.0 are most likely to say they are “Very unhappy.”
So, it’s very nuanced – not simply black or white. More on this in a bit.
And lastly, we come to one of the last stops on the GPA / life pipeline: health.
…and Healthy
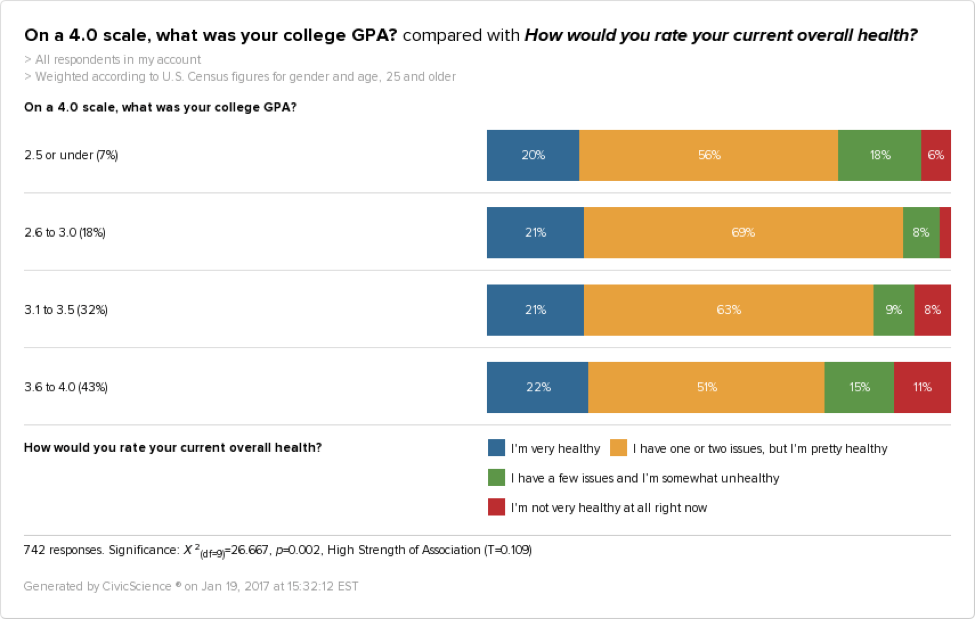
This is pretty interesting. There is almost no difference by GPA for those who answer, “I’m very healthy.” In fact, people who had a college GPA of 3.6 to 4.0 are 41% more likely than the other GPA groups to answer, “I’m not very healthy at all right now.”
The Book Report Version
In simple terms: Your GPA will not / does not affect every facet of your life down the road, so if you’re a student, take a breath. You can relax. Although there are some correlations between higher GPAs and traits like happiness and job satisfaction, the numbers aren’t static. They are not clear cut. The data are as nuanced as the people behind them, who have much more to their identity than simply a 2.4 or 4.0. If I had to propose one lesson from this lengthy post – it would be that.
As a last tidbit, here are some other fun correlations we found. People with a college GPA of:
- 2.5 or under are more likely to go to the movies at least once a month.
- 2.6 to 3.0 are more likely to be men.
- 2.6 to 3.0 are more likely to attend sporting events regularly.
- 3.1 to 3.5 are more likely to closely follow the NHL.
- 3.1 to 3.5 are more likely to use Netflix.
- 3.6 to 4.0 are more likely to be women.
- 3.6 to 4.0 are more likely to buy organic food.
- 3.6 to 4.0 are more likely to try new products before other people do.
Interested in other insights? Check out our recent posts on Donald Trump’s presidency, consumer privacy, and our top insights of 2016!