When Colorado and Washington passed landmark laws legalizing marijuana for recreational use on November 6th, it no doubt started countless conversations in state capitals and video game dens around the country. Activists from Oregon to Vermont will be emboldened to pursue similar laws in their states, unless they get distracted by a really good episode of the X-Files.
We wanted to begin tracking broader public sentiment about this issue since it will almost certainly be on the political landscape for months to come. So, from November 12th through 14th, we surveyed 19,426 Americans asking whether they supported or opposed the legalization, taxation, and regulation of marijuana in their states. The topline results and cross-tabs below were reweighted to represent the full US population based on…wait…what were we just talking about?
Oh right. Overall, we see in the chart below that a majority of Americans would support legalized marijuana but it is certainly a polarizing issue:
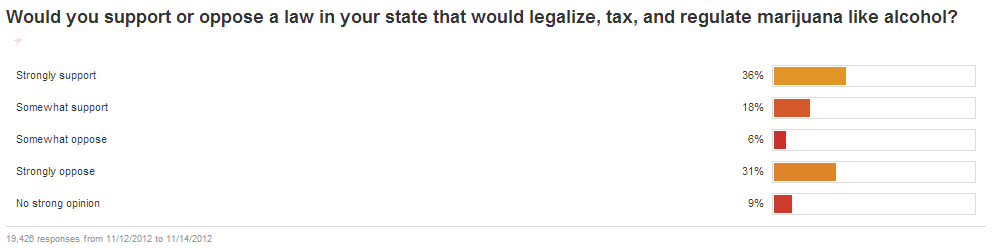
A full 54% of Americans support legalization, while 37% oppose it, and 9% have no strong opinion. 36% strongly support the idea, while a near-equal 31% strongly oppose it. This leaves 33% of respondents in the “Persuadable” category (25% ‘Somewhat’ responses plus 9% ‘No Strong Opinion’), who could be moved to one side or another by strategic marketing, peer pressure, constant judging by their parents, or maybe some really delicious-looking brownies. But mostly strategic marketing.

When we started crossing the results with all of the other questions in our system, we found a number of correlations, some quite useful for marketers on both sides of the issue and others quite funny. Let’s start with the main demographic and geographic differences.
Overall, men were more likely to strongly support legalization, coming in at a level over 7% “higher.” Conversely, women were much more likely to have no strong opinion on the issue.
When we look at the age breakdowns, we see two obvious correlations. First, support is clearly highest among respondents aged 25 to 34 probably because they finally have a decent job and can afford the really good stuff. At the other end of the spectrum, opposition is by far strongest among respondents over aged 65, not including those who may be smoking pot to clear up their cataracts and had trouble reading the question.

Now let’s look at the results in a few key political swing states: Florida, North Carolina, Ohio, and Pennsylvania. As you can see below, legalization receives overall support in all four states. Support is strongest in Florida, at 59%, where most people walk around like it’s legal anyway, and Ohio at 56%. Opposition is strongest in North Carolina, at 42%. Pennsylvania was the only state we looked at where strong opposition outweighed strong support (Can you even get weed in Pennsylvania?).
 If you were actually involved in the pro-weed or anti-weed movement, here are a few useful things you should know to inform your strategy:
1- The issue breaks predictably along party lines. Republicans OPPOSE legalization 55% to 38%, while Democrats SUPPORT legalization 70% to 21%. Independent voters are more likely to support the measure by a margin of 58% to 33%.
2- While that would seem to give an edge to the pro-weed folks, it’s not that easy. People identified as “Likely Voters” were 16% more likely to OPPOSE legalization. In other words, anti-weed interests should push for any kind of voter referendum during a minor off-year election, when most of the dope-smokers won’t get off the couch for five minutes to vote.
3- People who watch most of their network TV on NBC are way more likely (68%) to support legalization than viewers of other networks, probably because the Thursday-night line-up is freaking hilarious. Apparently potheads don’t watch American Idol, because support is lowest among frequent viewers of Fox. If you’re trying to reach Persuadable voters, you’ll find them watching ABC and especially CBS. If you want to be really smart, advertise to Persuadables when they’re tuning into their favorite talk show host, David Letterman. Stoners will be watching Jimmy Kimmel and Anti-Stoners will be watching Leno.

4- Among pro sports fans, people who follow pro hockey “Very Closely” are the most likely to strongly support legalization at 49%. The current lock-out must be really harshing their mellow. If you’re looking for Persuadables, they’re most likely casual fans of the NFL.
5- Cat People are 16% more likely to support legalization and Dog People follow the norm. People with no pets are most likely to strongly oppose legalization at 37%.
Last but not least, here are a couple of our favorite insights uncovered in our system:
– 59% of people who say they LOVE Doritos, support legalization (42% Strongly Support). BUT, here is the real twist, 67% of people who say they DON’T like Doritos also support legalization. Perhaps they’d like Doritos more if they just tried the Buffalo Blue Cheese flavor.
– 73% of people who LOVE Taco Bell support legalization (50% Strongly Support), reigning as the highest correlated attribute of the thousands in our system. We didn’t dare ask anyone about whether they loved the Doritos Locos Taco, for fear it would have crashed our servers.
– One last point as we head into the Thanksgiving holiday. If you’re scheming for someone to smoke with next Thursday while everyone else is watching football, look for the person who goes immediately for the apple pie on the dessert table. People who strongly support legalization are a whopping 26% more likely than anyone else to list Apple Pie as their favorite Thanksgiving dessert.

We will continue to study this topic in the months ahead, digging into more statewide numbers and tracking trends. Stay tuned.