THE GIST: American Idol’s declining ratings over the years have not affected every audience demographic equally, putting certain competitors at a significant disadvantage in the “nationwide” voting portion of the show.
I’ve watched every season of American Idol since the show started, including the latest reboot on ABC. My kids love it, for sure, but I get sucked into it too.
We yell at the TV when our favorite people are voted off – particularly when they’re outlasted by inferior singers. Those “injustices” feel worse every season, none more so than this one. Michael or Gabby should have won. I don’t care what anyone says. But I digress.
What if the outcomes don’t just “feel” different from the early seasons of the show? Two of the first three Idol winners and three of the first six were African-American. White men won nine of the last ten competitions. All three finalists this year were white, country/folk performers, even though six of the final fourteen were Black or Hispanic.
There was no shortage of outrage to be found on Twitter. “Americans are bigots,” they cried, as transgender competitor, Ada Vox, and vocally-superior African-American, Michael, were eliminated long before they should have been.
But these gloomy views of American bigotry are misplaced – at least as they relate to American Idol. Do you know why? Because “America” isn’t watching “Idol” anymore. Let me show you.
RATINGS DECLINE
It’s no secret that American Idol’s unprecedented TV ratings eroded over time – so much so that the show was sent to timeout for a full year in 2017. Seven-times (7X!) more U.S. households tuned in for the top-rated 2003 finale than the finale in 2015.
Here is a secret: The 66.67% decline from 2003-2015 was not spread evenly among every demographic or psychographic group in the United States. This, more than anything, could explain changing voting patterns – and outcomes – on the show over the years.
CHANGING AUDIENCE PROFILE
Unfortunately, we don’t have data about the American Idol audience in its maiden seasons. CivicScience didn’t even exist in its current form until 2011 and we didn’t start asking about the show until 2012. Fortunately, that gave us at least one full season of AI near its peak. Here’s how our question about American Idol trended from 2012 forward:
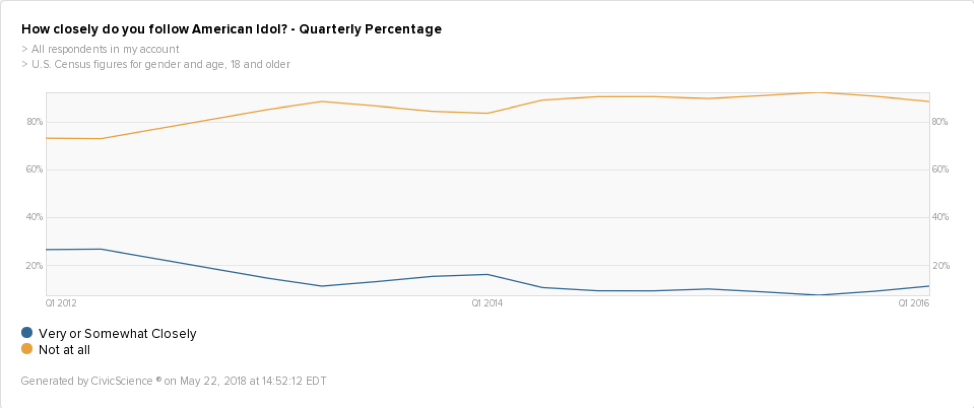
During the 2012 season, 27% of U.S. adults said they followed AI “very” or “somewhat closely”. By the end of the 2015 season, that number fell to just 8%, before bouncing briefly back to 11% during the show’s supposed-final season. When we asked people how closely they followed the show’s reboot this year, the numbers looked like 2015…at 8%.
In other words, the population of people who followed AI fell by over 70% (or 19 absolute percentage points) in just a four-season span. We can learn a lot by comparing the demographic and psychographic attributes of that changing population. To do this, we isolated two segments of consumers in our database – those who said they followed the show prior to June 2012 and those who said they followed the show from 2015 to the present.
DEMOGRAPHICS
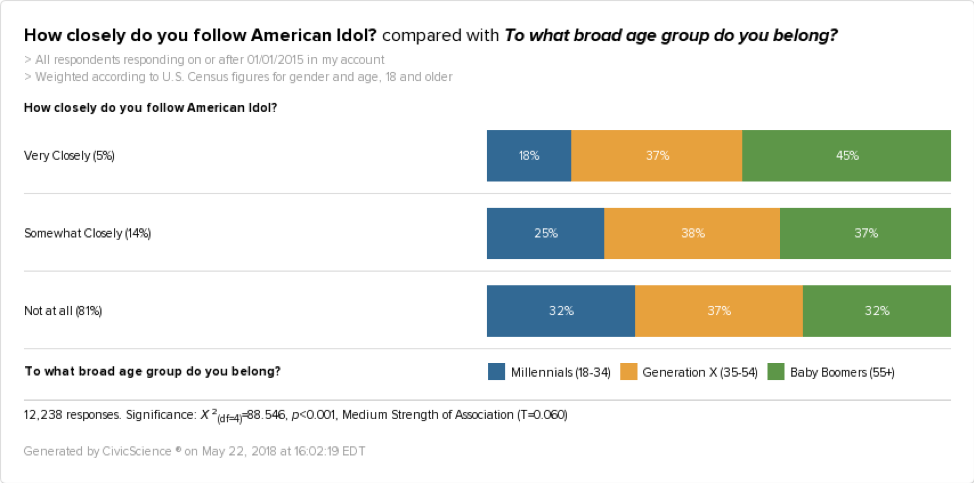
Nothing jumped off the screen more when looking at the American Idol demographics of the two groups like the age breakdown. In our 2012 segment, Baby Boomers made up 31% of AI followers. When we fast forward to our 2015+ crowd, however, that number jumped to 45%. This doesn’t mean that more Baby Boomers are watching AI. It means that the show is bleeding Gen X and Millennial viewers in droves. The gender-split stayed fairly consistent, with women making up the clear majority of viewers during both periods.
During the 2012 season, 30% of African-American adults watched AI at least somewhat closely, slightly above the 27% we saw for the full Gen Pop numbers. But when we looked at the 2018 reboot season, only 8% of African-Americans followed the show, compared to 9% of Whites and 12% of Hispanics. Already the smallest of the three groups in absolute numbers, African-Americans are now watching “Idol” at a lower relative rate than the others.
PARTISANSHIP
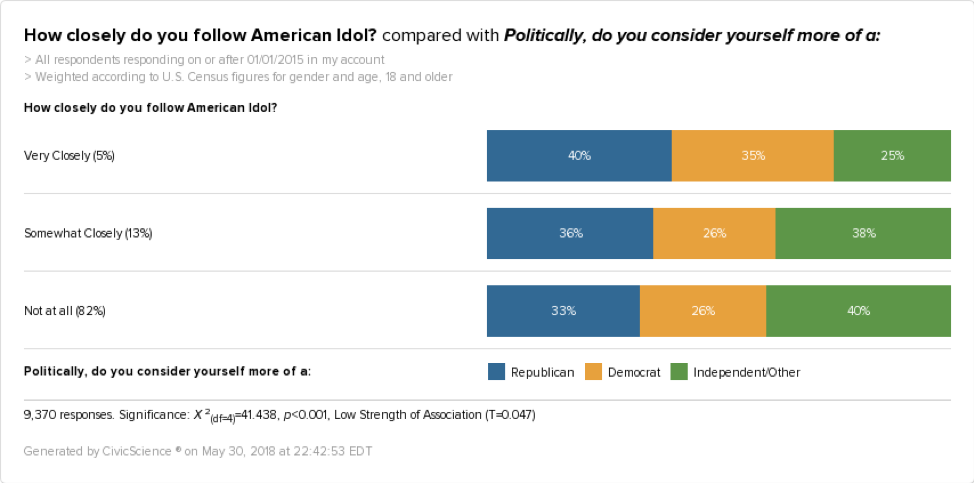
With all the demographic shifts we’ve seen, it shouldn’t surprise you to learn that the political makeup of AI viewers has shifted as well. In our 2012 segment, 30% of the audience members who followed AI “Very Closely” identified as Republican. By the time we got to 2015 and later, that number leapt to 40%.
MUSIC PREFERENCE
And finally, this may be the only chart that really matters. Again, unfortunately, we don’t have these numbers trended over time but here is a snapshot of post-2015 American Idol viewers crossed by their preferred music genre, between Country, Pop, and Hip-Hop/R&B fans:
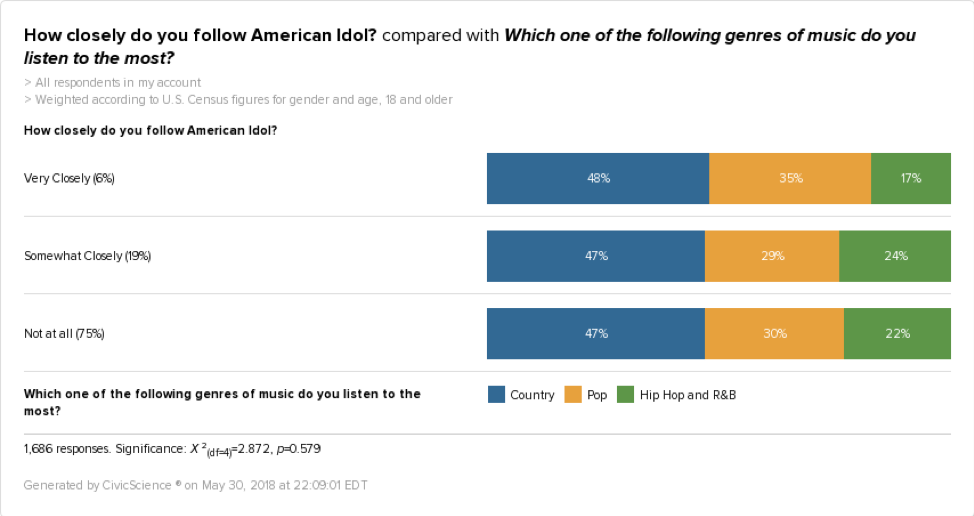
Looking at this, it’s no wonder why certain types of artists have an uphill climb when the viewing audience begins voting for their favorite performers. Those are difficult disparities to overcome.
(A LITTLE) HOPE FOR THE FUTURE
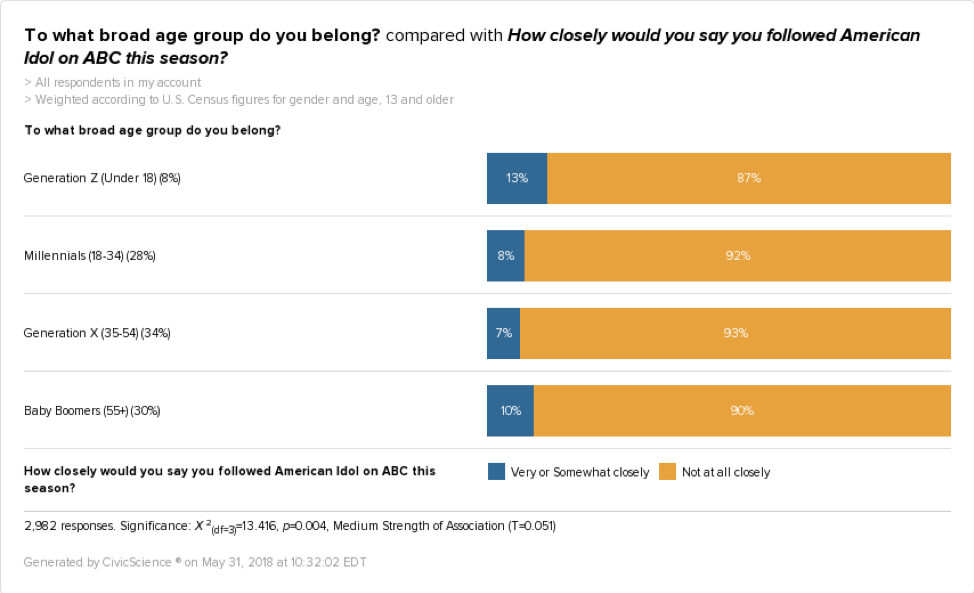
Despite AI’s ratings and audience trends, a glimmer of hope may be found in America’s youngest generation. Ever so slightly, Gen Z Americans watched the most recent season of AI at a higher overall rate than other generations. They aren’t earth-shattering numbers, especially since 13-to-17-year-olds make up a relatively small portion of the population. But if AI can stick around while that audience grows (and grows up), maybe things will change.
But until or unless that happens, don’t be so surprised when your favorite AI performer is voted out of the competition. Things were different 15 years ago, when a single TV show could capture almost the entirety of the U.S. population. Those days are likely gone forever.