This post was written by Charlotte Forsythe, who spent her summer interning at CivicScience.
As a sophomore in high school, I competed in the Pittsburgh Data Jam where I heard the phrases “big data” and “data analytics” for the first time. The actual work my team did for the competition is all a blur now, but these phrases stuck with me. For some reason, I had a feeling we’d meet again down the road. Now, four years later, as a recently declared Economics and Applied Computational Mathematics and Statistics double major at the University of Notre Dame, I decided that reentering the world of data science might be a good idea. Who knows where it could lead, right?
My first week as an intern at CivicScience was spent poking around the InsightStore and scrolling through months of past blog posts. I learned about CivicScience’s objectives in collecting and analyzing data, but I wanted to better understand the ways they use the data once they have it; how they sculpt it into a product. After spending a few days exploring the InsightStore, I had a basic idea of the tools used to generate the statistics and extract insights from the data, but it didn’t fully click until I read a blog post about juice cleanses. Though the topic was random, it put the company’s mission into perspective for me. I was drawn to this idea of taking complex data analysis and presenting it in a clear and straightforward way that engages the public.
After growing more comfortable with the platform I would be using for the rest of my time at CivicScience, I was given my first project. I was tasked with looking for correlations among the timeview graphs of long-running syndicated questions. My goal was to find any graphs that had a sudden change, gradual change, or oscillating trendline. If I found one (which I did!), I would look through the other questions that were strongly correlated with it to see if they demonstrated a similar trend. I enjoyed spending time scouring through hundreds of questions looking for quirks in their graphs, but I soon realized that with all that effort comes minimal return. Dozens of questions might have odd trends, but finding another one that has a high strength of association and similar peculiarities is unlikely. Nevertheless, I kept searching for the fun and fascinating rather than obvious correlations, and I ended up finding some of interest!
Here are three of my favorite correlations:
Political Media Consumption & George Clooney
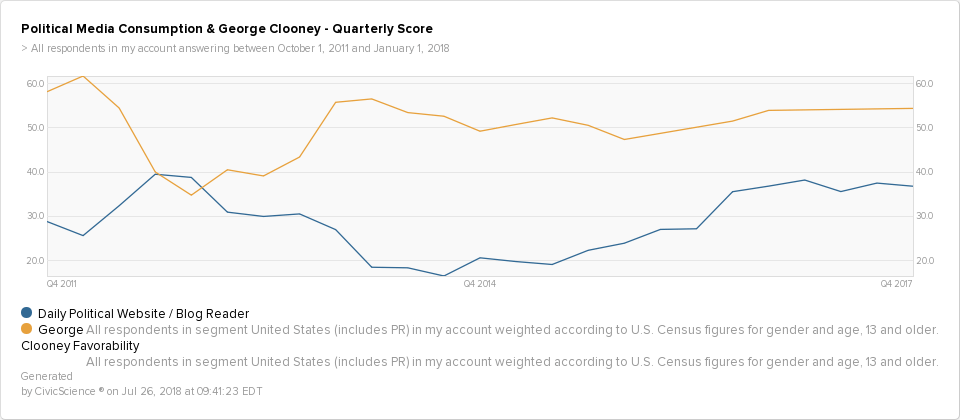
- As the number of people reading political blogs and websites on a daily basis increases, George Clooney’s favorability decreases.
- This inverse relationship could be due to the fact that Clooney is an active member of the Democratic Party who is vocal about his liberal views, while the majority of this question’s respondents hold more conservative or moderate views. Reading about George Clooney’s political opinions would cause them to view him unfavorably. Additionally, even liberals could be upset with what Clooney says, not because of the content, but because of the way he says it (see “Smug Alert!” episode of South Park).
Fitness, Food, & Fashion
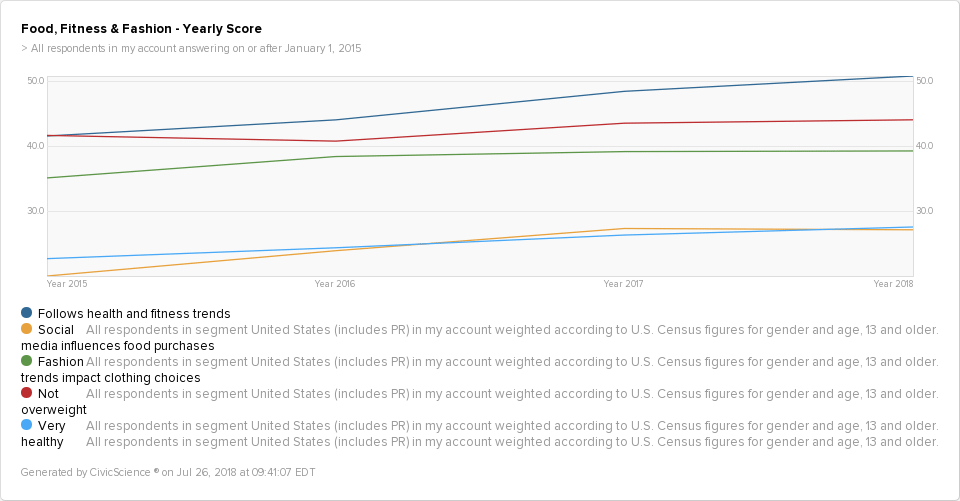
- There has been a gradual increase over the past few years in participation in health and fitness trends. During the same time period, social media’s influence on the type of food people purchase and fashion trends’ impact on people’s clothing choices have both increased as well.
- It’s possible that with the rise of certain styles that often circulate social media, people’s desire to “look good” has affected their health and fitness habits. More people rate their current health as “very healthy,” and fewer people consider themselves to be overweight. With more people exercising and eating right, they might have grown in confidence and as a result are willing to try new fashion trends.
- It’s also possible that the proliferation of diet/fitness trends at our fingertips has simply made it easier for people to get healthy, upholding the initial promise of the internet that “information is power.”
Print publications, Coupons, & Reusable Bags
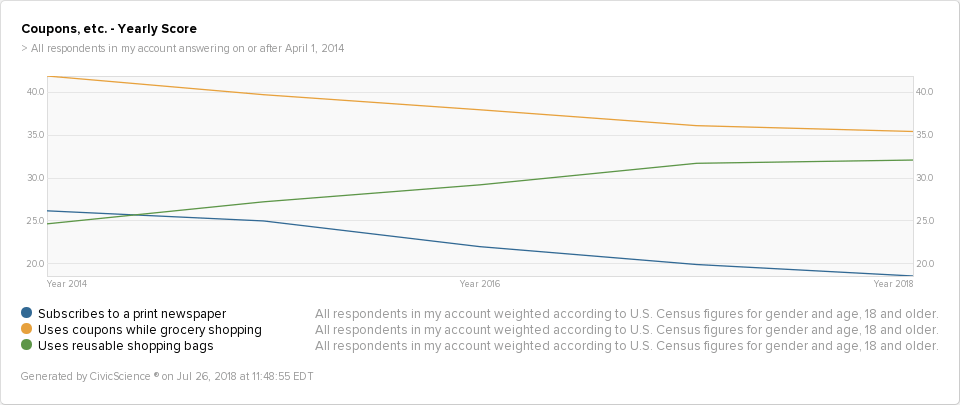
- As the number of people who use coupons and subscribe to print newspapers decreases, the number of people using reusable shopping bags increases. It seems that people care more now about saving the planet than they do about saving a little extra money.
- It’s possible that these graphs look similar simply because the push to help the environment and continuous growth in technology have happened simultaneously. Newspapers can be found online now so people aren’t subscribing to receive print copies anymore, and thus are not cutting coupons out like in the past. Reusable shopping bags, however, are an easy way to make a small impact every day and their availability isn’t affected by factors outside of the individual’s choice to use them.
In addition to identifying correlations, I also spent time creating segments from questions asking about respondents’ likelihood of watching new, upcoming TV shows. I then used these segments to search for changing viewer demographics among television genres over the past few years. With every passing day, I developed a better understanding of how to look at the data in different ways and focus on what was most captivating and relevant. The timeview correlations and TV Upfronts research were my two main projects throughout the summer, but I also audited weighting schemes using new census reports, sat in on a client conference call and an entire company meeting, chatted with various employees about their roles at CivicScience, launched my own questions and analyzed the results, and of course, wrote this blog post!
Everything I worked on and observed during my time at CivicScience has helped me dive deeper into an understanding of the world of data science, but one of my favorite parts of this entire experience was simply exploring questions in the database whenever I had spare time. Watching newly asked questions collect results is exciting because they show right away how the public is feeling about something while perusing long-running questions with hundreds of thousands of responses reveals how opinions and behaviors have changed over time. I realized that there’s something to gain from every question, you just have to know what to look for (which I’m still learning to do).
Though I came into this summer unaware of what exactly this internship entailed, I leave it extremely grateful to have had the opportunity to work with such creative, motivated minds who have helped kick-start my professional journey to discover my role in the wild world of data in which we live. From understanding the importance of weighting data to learning about what is statistically significant versus what only appears to be, to simply improving my Microsoft Excel skills, I gained more knowledge and experience than I ever thought possible just by being at CivicScience for a few short weeks.