Sometimes, being a writer is hard. There are creative blocks, limited time, and don’t even talk to me about the endless hand cramps. I could go on, but I won’t (could it have to do with that whole hand cramp thing?).
Fortunately for me, our system is there to help out. When time is pressed and fingers are shaky, I simply click one button, and poof, a machine-generated summary of the data in natural language. I’d like to think that it’s not as engaging as what I would have written, but it’s 2017. Robots are the new organic beings.
Anyway, I thought I’d put this option to good use, in discussing a platform that rarely garners the same attention as Facebook, Twitter, Instagram or Snapchat, but one that still holds large influence, particularly among Gen Z. Tumblr.
Without further ado, here’s what our little Shakespearian intelligence program wrote up. Note that I shortened the piece just a bit, to only include insights about those who use Tumblr Weekly or More:
How Often Do You Use the Social Media Site/App Tumblr?
September 14th, 2017
1. Introduction
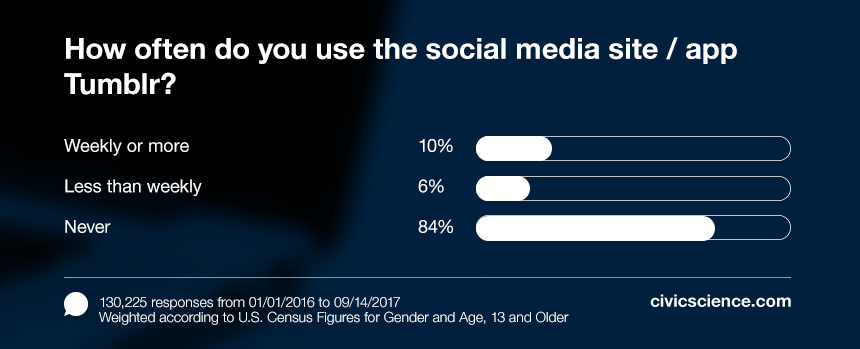
The question, “How often do you use the social media site/app Tumblr?” was answered by 130,220 people from January 1, 2016 to September 14, 2017. Results are weighted according to U.S. Census figures for gender and age, 13 and older, and answers are grouped by Tumblr Usage. The data is filtered to include only respondents responding between 01/01/2016 and 09/13/2017 in my account. Never is the most popular answer group with 84% of the responses. The least popular answer group with 6% of the responses is Less Than Weekly. The margin of error is 1%.
Insights were mined for each answer group by comparing respondent profiles across a wide range of attributes. Significant differences were found with regard to technology usage, current events, demographics and profile, and other categories. These differences are explored in the following sections.
2. Differences For Answer Group Weekly Or More
These differences were detected with relation to technology usage. Active Snapchat users are more than 3x as likely to answer Weekly or More. Respondents who answer Weekly or More are more than twice as likely to choose music based on social media influence, more than twice as likely to own or want a virtual reality product, and more likely to own or want a smartwatch. Respondents who answer Weekly or More are also more likely to choose TV shows and movies based on social media influence, to own or want a smart home automation product, and to spend at least an hour each day on social media. Respondents answering Weekly or More are also more likely to follow technology trends, to be addicted to their digital devices, and to try new products before other people do. Respondents who answer Weekly or More are also more likely to watch streaming video, to write negative online reviews, and to subscribe to T-Mobile.
Only one significant difference was observed with respect to current events. Respondents answering Weekly or More are more likely to follow music trends.
Several differences were identified regarding shopping habits and behaviors. Regular upscale restaurant diners are more than 3x as likely to answer Weekly or More, and people who choose clothing based on social media influence are more than twice as likely to answer Weekly or More. Respondents answering Weekly or More are more likely to choose personal electronics based on social media influence, to be generally price-conscious, to buy environmentally friendly products, and to use reusable shopping bags. People who answer Weekly or More are less likely to be most influenced by TV ads, but they are more likely to be most influenced by social media.
Several differences were identified regarding brands. Respondents who answer Weekly or More are more likely to own or want a wireless speaker system. Those answering Weekly or More are more likely to use Netflix, to dine regularly at fast casual restaurants, and to dine regularly at casual restaurants. People who answer Weekly or More are less likely to favor restaurants with healthy menu options, but they are more likely to favor restaurants with a pleasant atmosphere.
Several differences were discovered with respect to demographics and profile. Respondents who answer Weekly or More are less likely to own their homes, whereas those who live with their parents are more than twice as likely to answer Weekly or More. Under 18-year-olds are more than twice as likely to answer Weekly or More. Those answering Weekly or More are more likely to listen to streaming music and to actively use Facebook. Respondents who answer Weekly or More are more likely to live in the city.
Some differences were found relating to media consumption. Respondents who go to the movies at least once a month are more likely to answer Weekly or More. Those answering Weekly or More are more likely to be fans of TV documentaries, to be fans of reality TV, and to be fans of TV sitcoms. Those who answer Weekly or More are also more likely to be fans of travel, home, and cooking TV shows, to be fans of music and entertainment TV, and to be fans of TV dramas.
Relating to politics and ideology, two differences were uncovered. Those who answer Weekly or More are more likely to volunteer at least once a week and to be concerned about environmental issues.
Some differences were found with relation to entertainment. People answering Weekly or More are more likely to closely follow the NBA and to attend sporting events regularly. People answering Weekly or More are also more likely to closely follow the NHL, to tell others about new brands and technology, and to closely follow college basketball. On the other hand, people answering Weekly or More are less likely to closely follow the NFL.
3. Conclusion
The answer group Weekly or More received 10% of the responses. Active Snapchat users and regular upscale restaurant diners are more than 3x as likely to answer Weekly or More. Respondents who answer Weekly or More are more than twice as likely to eat most often at upscale restaurants, and those who live with their parents are more than twice as likely to answer Weekly or More. Further differences were found with relation to technology usage, current events, shopping habits and behaviors, and others.