… Well most of it anyway.
Automation is all around us in various industries. The fast-food industry is ramping up automation in restaurants, and Uber has launched a fleet of self-driving cars. Some are worried that computers and automation will replace their jobs, while others are welcoming the new technology, hoping that it will make their lives easier. In the case of our recently announced platform features in the InsightStore™, it’s the latter.
We know today’s consumer insights and research professionals are being pulled in all directions. They are scrambling to develop reports and presentations, all while trying to uncover valuable insights for their company.
So what if I told you that automation could one day allow you to create an entire written report for your boss or your colleagues with nothing more than the push of a button? That would be pretty nice, right? Well, that day is here.
Take a look at this. We asked the following question to over 2,000 people:
Our new natural language summary feature did the rest. Admittedly, it’s V 1.0 but it’s a huge start…
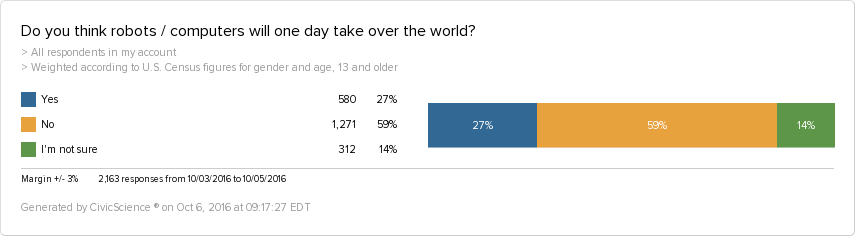
Do You Think Robots / Computers Will One Day Take Over The World?
- Introduction
The question, “Do you think robots / computers will one day take over the world?” was answered by 2,163 people from October 3, 2016 to October 5, 2016. Results are weighted according to U.S. Census figures for gender and age, 13 and older, and they are analyzed per answer choice. No is the most popular answer choice with 59% of the responses. The least popular answer choice with 14% of the responses is I’m not sure. The margin of error is 3%.
Insights were mined for each answer choice by comparing respondent profiles across a wide range of attributes. Significant differences were found with regard to technology usage, food and beverage, shopping habits and behaviors, and other categories. These differences are explored in the following sections.
- Differences For Answer Choice No
With regard to technology usage, people who answer No are less than half as likely to own or want a virtual reality product.
Several differences were observed with regard to shopping habits and behaviors. Respondents who answer No are less likely to favor restaurants with lower prices, to choose food items based on social media influence, or to be conscious of price when shopping for electronics.
Two differences were identified regarding lifestyle. People answering No are more likely to attend sporting events regularly. In addition, people who tell others about their favorite products are more likely to answer No.
Only one significant difference was uncovered with relation to food and beverage. Respondents answering No are less likely to drink clear spirits regularly.
With regard to media consumption, several differences were uncovered. People answering No are more likely to be fans of TV news. People answering No are less likely to go to the movies at least once a month or to follow music trends.
These differences were discovered with relation to brands. People answering No are more likely to favor restaurants with healthy menu options. Conversely, those who answer No are less likely to eat most often at fast food restaurants.
Some differences were uncovered with respect to demographics and profile. Those who answer No are more likely to live in a rural area. People answering No are less likely to be under 18 years old, whereas people answering No are more likely to be 55+ years old. People answering No are less likely to be unemployed or to live with their parents.
These differences were observed with relation to entertainment. Those who answer No are more likely to closely follow college basketball and to closely follow the MLB.
With relation to politics and ideology, one difference was uncovered. Respondents answering No are more likely to volunteer at least once a week.
With regard to health and wellness, those answering No are more likely to eat most often at local independent restaurants.
No significant differences were found with regard to personal finance or current events.
- Differences For Answer Choice Yes
Differences were uncovered with relation to food and beverage. Those answering Yes are more likely to drink clear spirits regularly. In addition, people who buy locally grown food are more likely to answer Yes.
Differences were uncovered with relation to technology usage. People who answer Yes are more likely to own or want a smart home automation product. On the contrary, those who research online reviews before making a purchase are less likely to answer Yes.
A couple of differences were uncovered regarding health and wellness. Regular casual restaurant diners are more likely to answer Yes. In contrast, those who eat most often at local independent restaurants are less likely to answer Yes.
Two differences were observed relating to entertainment. People who answer Yes are more likely to go to the movies at least once a month. Likewise, NHL fans are more likely to answer Yes.
These differences were detected relating to lifestyle. Those who follow music trends are more likely to answer Yes. On the contrary, people who tell others about their favorite products are less likely to answer Yes.
These differences were uncovered with relation to shopping habits and behaviors. People who answer Yes are more likely to choose food items based on social media influence and to be conscious of price when shopping for electronics. Similarly, those who favor restaurants with lower prices are more likely to answer Yes.
With regard to personal finance, people answering Yes are more likely to be unemployed.
Some differences were detected with respect to demographics and profile. 55+ year olds are less likely to answer Yes, but 18-34 year olds are more likely to answer Yes. Homeowners are less likely to answer Yes, as are parents.
No significant differences were found with regard to politics and ideology, current events, media consumption, or brands.
- Differences For Answer Choice I’m Not Sure
These differences were discovered with regard to demographics and profile. Respondents who live in the suburbs are more likely to answer I’m not sure. On the contrary, 55+ year olds are less likely to answer I’m not sure.
No significant differences were found with regard to technology usage, shopping habits and behaviors, health and wellness, personal finance, current events, food and beverage, lifestyle, brands, entertainment, politics and ideology, or media consumption.
- Conclusion
No is the most popular answer choice, receiving 59% of the responses to the question, “Do you think robots / computers will one day take over the world?” Those answering No are more likely to attend sporting events regularly. People answering No are less than half as likely to own or want a virtual reality product, less likely to favor restaurants with lower prices, and less likely to go to the movies at least once a month. More differences were found with regard to technology usage, shopping habits and behaviors, lifestyle, and other topics.
I’m not sure is the least popular answer choice with 14% of the responses. Respondents who live in the suburbs are more likely to answer I’m not sure. Conversely, 55+ year olds are less likely to answer I’m not sure.
The answer choice Yes received 27% of the responses. Respondents answering Yes are more likely to drink clear spirits regularly and to choose food items based on social media influence. People who research online reviews before making a purchase are less likely to answer Yes, as are those who tell others about their favorite products. Further differences were observed regarding food and beverage, technology usage, health and wellness, and other topics.
And this is just the beginning. We plan to continue to refine and develop this time-saving technology in order to make it even more powerful. The theme of our recent release is all about saving our users time. For more about our consumer data platform and the new features, check out this summary. And reach out to us if you want to learn more!
In the meantime, is there a business question you have? We help brands and media companies uncover game-changing insights every day. If you have a strategic business question, just ask.