Our hometown of Pittsburgh was the epicenter of America’s political maelstrom this week. In case you were living under a rock like this guy, here’s why:
- A special election was held to replace a disgraced Republican U.S. congressman;
- President Trump made multiple visits to the region to stump for Republican Rick Saccone, who saw over $11M flow through his campaign. Joe Biden and others rallied voters for the Democrat, Conor Lamb, who spent $6M;
- People all over the country were glued to their TVs Tuesday night to follow the returns;
- The race – which Lamb seems to have won – came down to a few hundred absentee ballots in a couple rural districts;
- All of that happened just to elect a Congressman to an 8-month term in a district that won’t exist in 2019;
- Sadly, none of that even seems all that outrageous anymore.
So, why all the fuss? Because many people saw the election as the first major referendum on the Trump presidency and a harbinger of the higher-stakes midterm elections next fall. Lamb winning in a congressional district that Trump won by 20 points just 16 months ago isn’t a promising sign for Republicans.
And why did Lamb win? Well, Republicans will say it’s because Saccone was a weak candidate. Democrats will say that voters are fed up with Trump’s antics already and that Lamb represents the candidate of the future. They may all be correct. We’re not political pundits.
But we’ll pose another theory.
FOLLOW THE MONEY
Seven years ago, CivicScience launched a first-of-its-kind index to track U.S. economic sentiment in real-time. Our methodology, while radically different from other indices like it, proved to not only line up with the more traditional consumer confidence measures; it can help predict those other measures, as well as a whole host of other things like the S&P, retail sales, and more. The index (“ESI”) has been running every millisecond of every day since 2011.
One of the unique features of our ESI is its ability to look at myriad profile attributes of the consumers who make up our survey. This allowed us, for example, to see a significant downturn in consumer confidence in 2013, among white, older, rural, male adults, who later turned out to comprise the core of Donald Trump’s voter cohort. Shortly after the 2016 election, we saw an immediate decline in consumer confidence among Hispanic Americans, which later manifested itself in retail sales at companies like Target.
So, we wondered, as the U.S. 18th Congressional District special election unfolded, could we find anything in our data that might shed light on the eventual outcome? Here’s what we found:
PITTSBURGH VERSUS THE NATION
When we compare the findings of our ESI and the subcategories that comprise it among residents of the Pittsburgh metro area (*) to those of the nation as a whole, we see a mix of results.
Start by looking at the full Economic Sentiment Index over time, which calculates a score based on five sub-indicators we track:
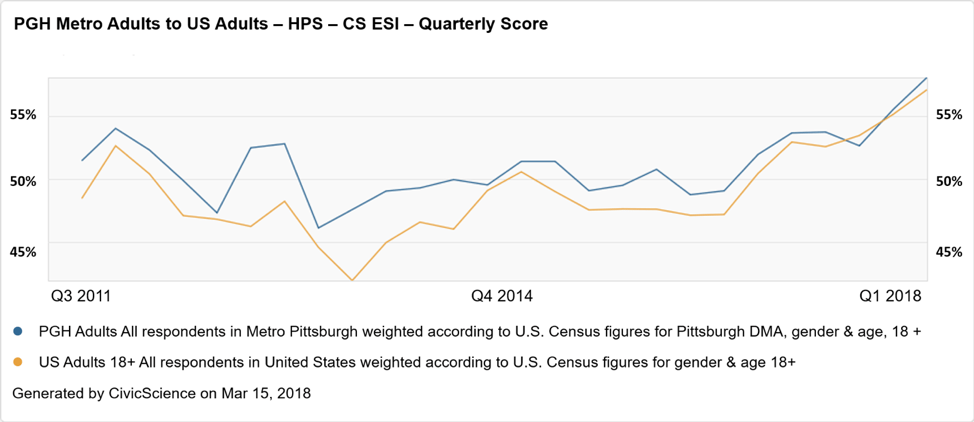
Overall, the results are quite similar, with a small jump in the Pittsburgh area in 2013 and 2014, which remained slightly higher than the U.S. average, before lining up perfectly beginning in 2017. Attitudes toward the broader U.S. economy and the job market showed similar alignment over the past 6-plus years.
Pittsburgh has consistently hovered above the national average on two sub-indicators: attitudes toward making major purchases and attitudes toward the housing market. Take a look at the housing market numbers:
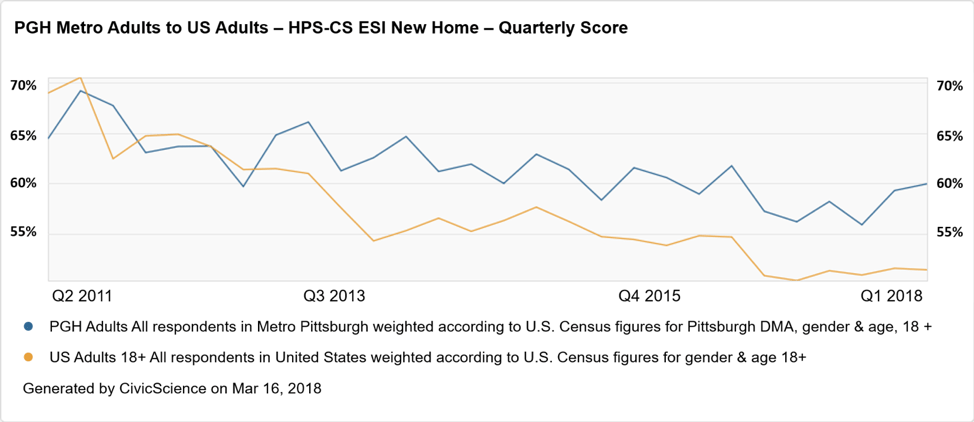
Notice how the Pittsburgh results and the national results follow a parallel path. Even as Pittsburgh-area residents over-index in confidence toward the housing market, the relative trend lines have remained consistent.
(*- When we gather geographic data about our respondents, we map them by region of the U.S., state, and “metro area,” otherwise referred to as Designated Marketing Area (DMA). The results below are calculated from among respondents in the Pittsburgh Metro area, which encompasses the PA18 congressional district but other communities as well. It’s not a perfect solution but we believe it’s a close enough proxy for these purposes.)
LIVE BY THE SWORD, DIE BY THE SWORD
But look what happens when we compared the Pittsburgh region to the rest of the country on our final indicator – confidence in personal finances. This instrument measures how optimistic people are about their personal financial situation.
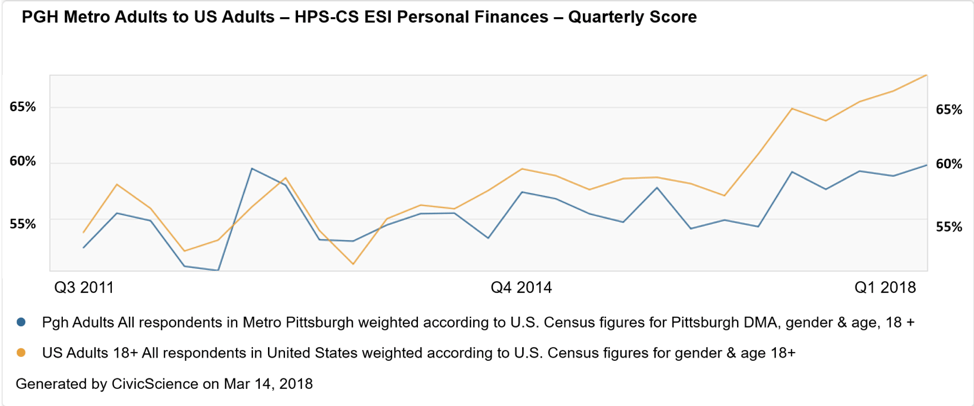
For the most part, the Pittsburgh Metro numbers stayed relatively close to the national average from the time we started the index until the third quarter of 2014. There we began to see separation, as confidence on the national level climbed 2 points by the 3rd quarter of 2016, while the Pittsburgh numbers fell over a ½ point during the same period. This declining personal financial optimism could certainly explain why disgruntled voters in the PA’s 18th Congressional District pulled the lever so eagerly for Trump.
Then, that 2½-point deficit began to widen. By the end of 2016, the gap between the Pittsburgh region and the nation grew to over 6 points. Pittsburgh experienced a brief jump in Q1 of 2017 in parallel with the national trend, but, between that time and Q1 of this year, Pittsburgh remained flat, while national optimism continued to climb. As of Tuesday, March 13, a full 8 points separated the U.S. numbers from the Pittsburgh numbers.
WHAT’S IN YOUR WALLET?
Maybe Conor Lamb’s surprising victory on Tuesday had something to do with Lamb’s stellar grassroots campaign, Rick Saccone’s mustache, all of the scandals and firings that have embroiled the Trump presidency, or an overall negative mood about the socio-political landscape in America right now. Or, maybe people voted with their wallets because all the personal financial optimism that’s sweeping the nation isn’t touching Southwestern Pennsylvania.
The easiest explanation might be the best one.
Be careful not to assume that widespread consumer confidence means that everyone is basking in the glow. That’s how we were all so surprised by the 2016 election in the first place.