I’m writing this while flying home from the American Association for Public Opinion Research’s annual conference in New Orleans. AAPOR is a body of academic, government, and industry scientists who, only a year or two ago, would have slammed the door in our face over our “radical” methodology – let alone invite me to speak. I half-expected to be ambushed. But no. It seems the industry is beginning to embrace new ideas and methodologies. It was cool to see.
Anyway, enough about me. Let’s talk about our data. Here’s what we’re seeing this week:
Consumer sentiment declined for the third straight reading and fifth out of the past six. While the overall drop was tiny over the past two weeks – less than a full point – the lurking problem is the erosion of consumer confidence in the U.S. economy, which reached its lowest point since the November election. Most of the decline occurred in the past 4 days, reinforcing the role that political news is having on broader economic attitudes.
A large percentage of Millennials would opt for student loan repayment over a 401K contribution from their employer. As someone whose staff is about 80% Millennial, this one really interested me. It tells me two things: 1) Younger people are saddled with a ton of student debt and 2) They’re confident in their ability to save for retirement on their own – which is consistent with numbers we shared with CNBC over two years ago.
People aren’t just getting married later, they’re getting married less. I’m going to write a lot more about this – particularly its impact on consumer behavior – but the changing dynamics of marriage in the U.S. are remarkable to watch. Start with the bell curve evident in the chart below: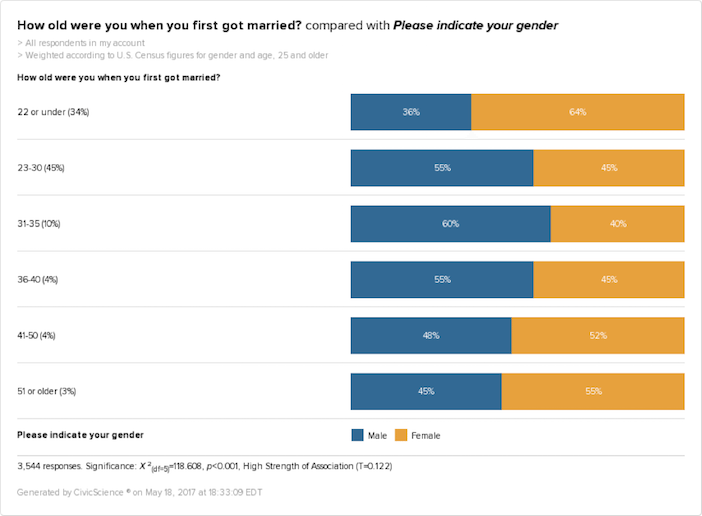
Notice how much more likely women are than men to report getting married when they were 22 or younger. This group is dominated by Baby Boomer women, who, we can infer from the bell curve, married older men on average. The numbers quickly shift, with men comprising the larger group of 31 to 35 ‘marriers.’
It’s interesting to see that among the 7% of current Americans who didn’t get married until 41 or older, they were more likely again to be women, presumably marrying younger men, on average. The numbers really change, though, when we look only at Millennials and Gen Xers. How? I can’t tell you yet. You’ll just have to keep opening my email.
Judging by all your great (and hilarious) comments last week, I guess you enjoyed the frivolous stats I shared. So, here are some new ones:
– 62% of people send a follow-up text to correct a typo in a previous text.
– 40% of people have sent an embarrassing text to the wrong person.
– 39% of people have received a funny text from a wrong number.
– 21% typically wait a few minutes to respond to a text to make it look like they’re busy.
See. And you thought you were the only one.
Hoping you’re well,
JD